Sample deck

Fernbrook Analytics, seed deck

A fictional company. Ten slides, every figure taken from one 3-statement model.

Sample work, fictional company

This is the deck from the sample read, rebuilt after the read. The numbers match the live model on the home page at $400 a month.
  1. Slide 1 of 10. Fernbrook Analytics: daily inventory forecasts for restaurant groups. Seed round: $1.8M. Sample work, fictional company. (opens full size in a new tab)
    Slide 1 of 10: Title
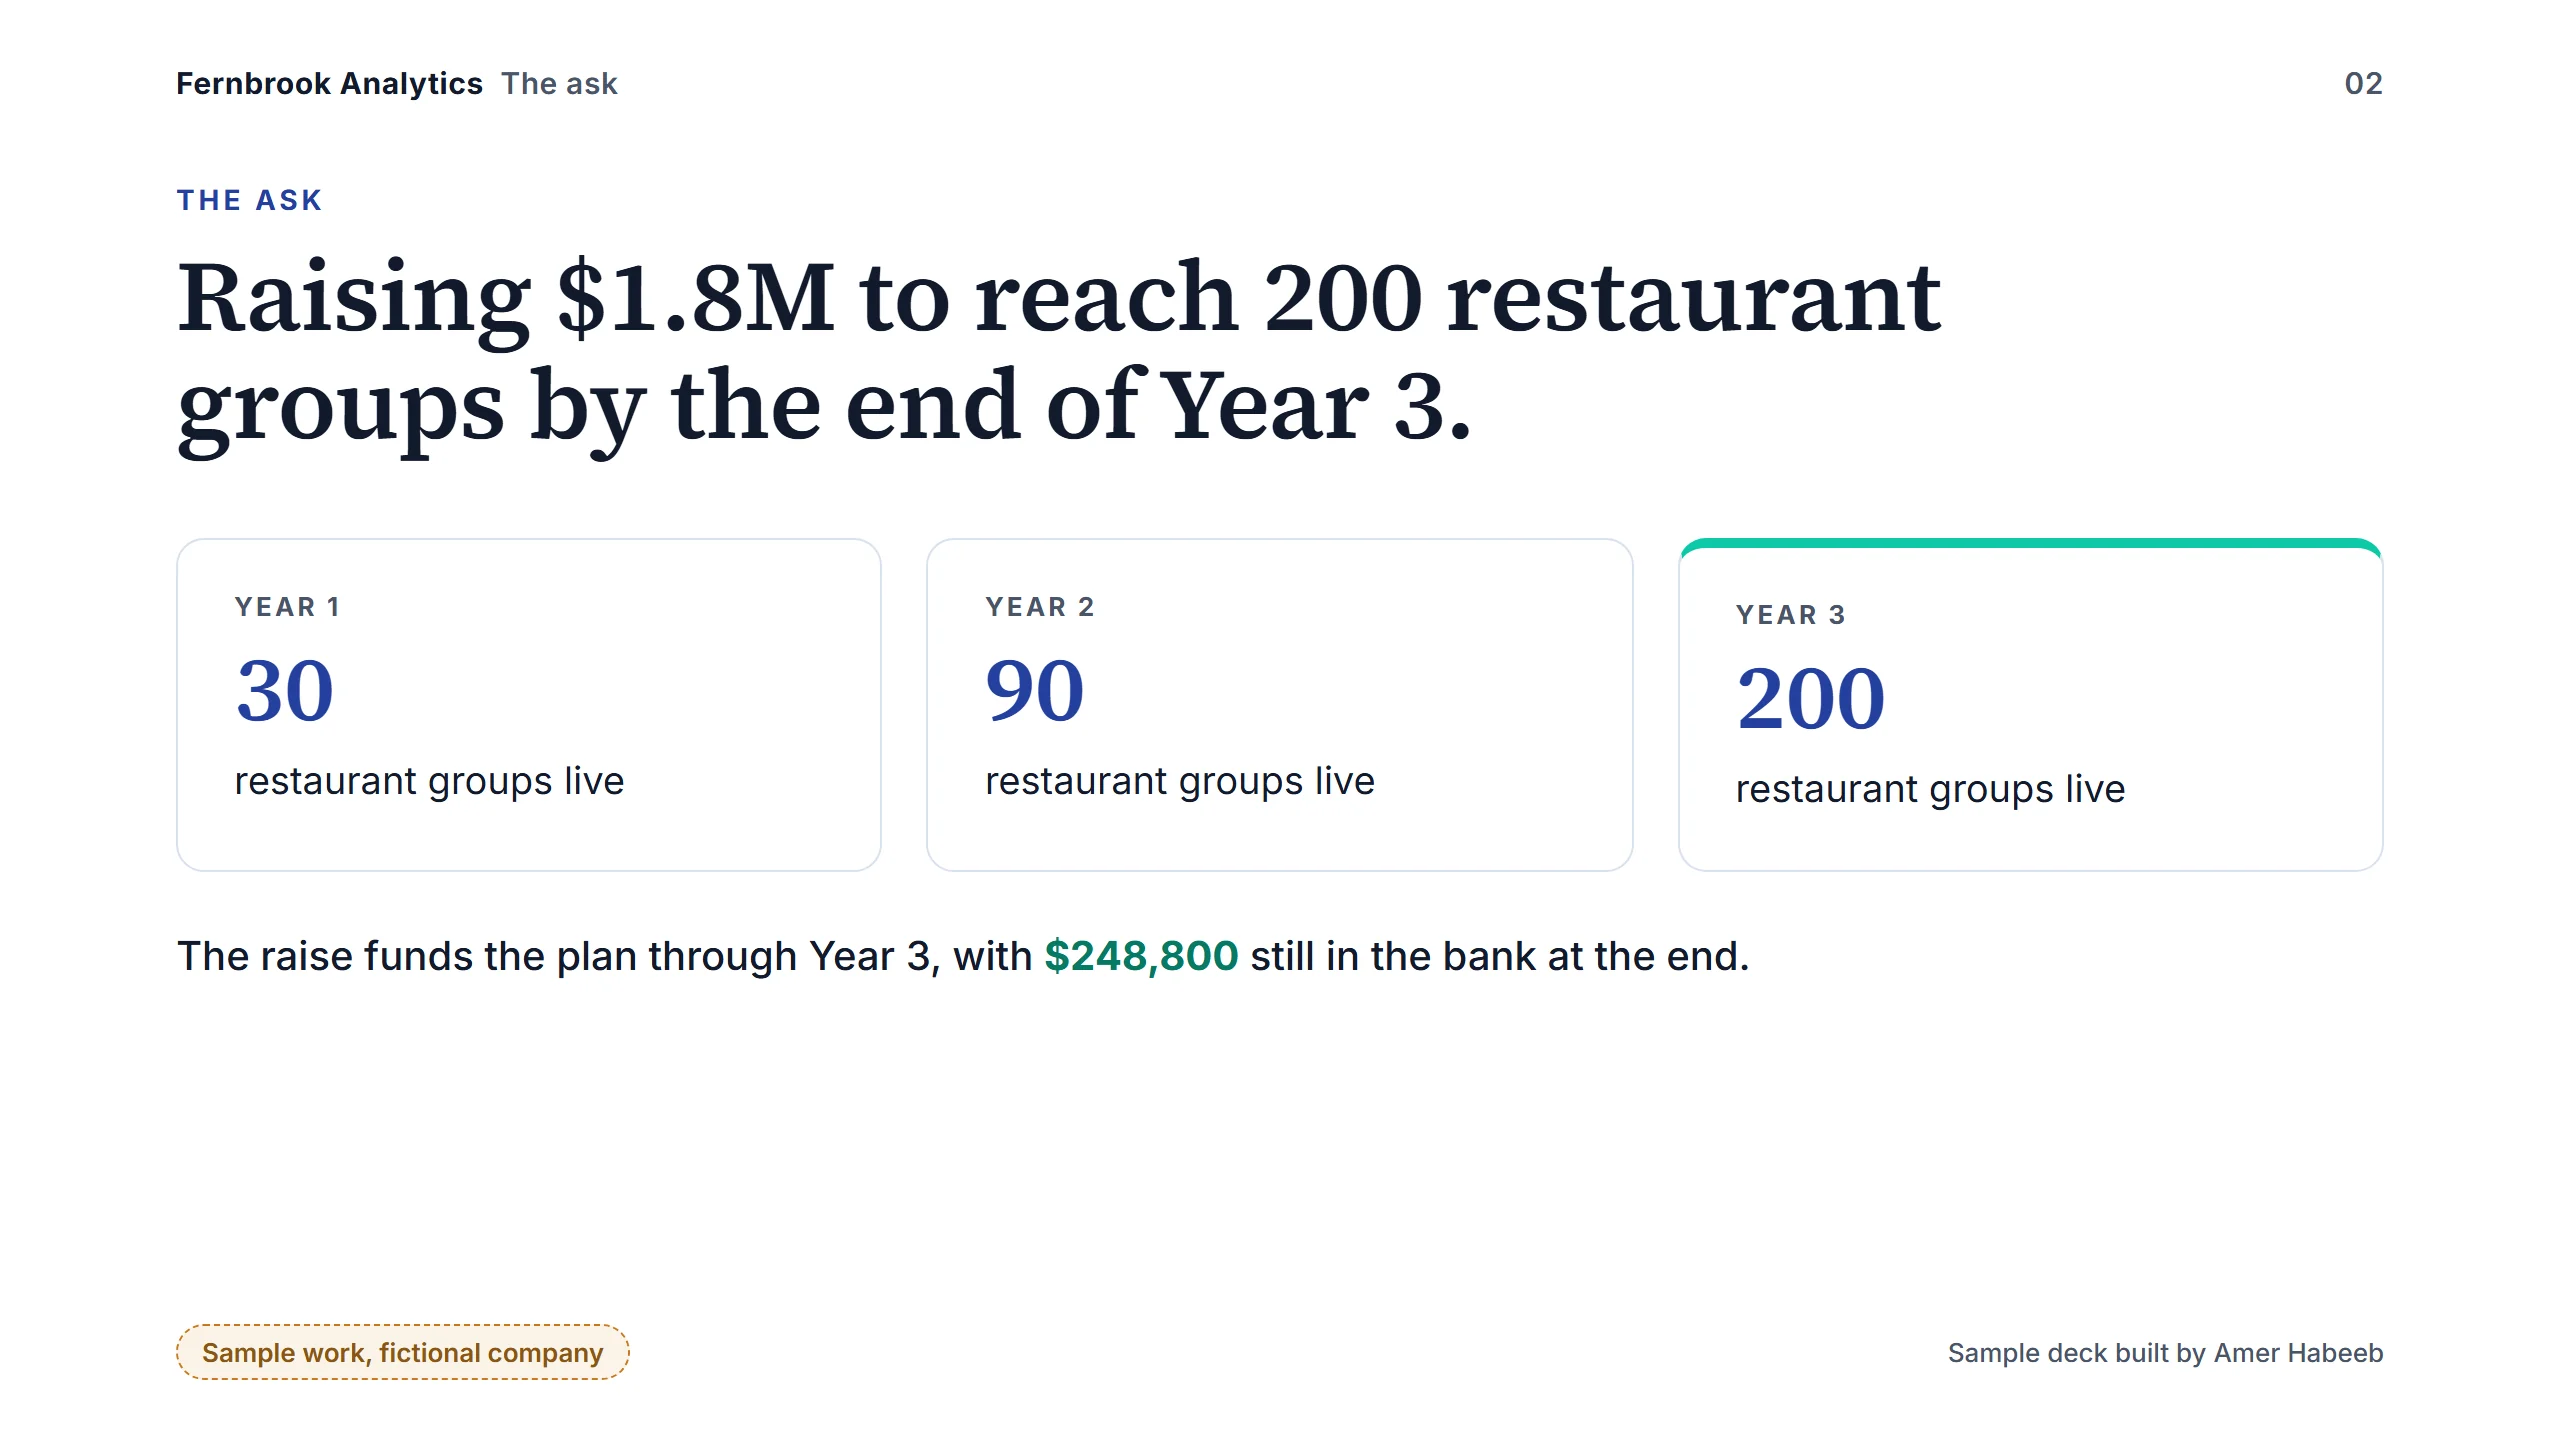
  2. Slide 2 of 10, the ask. Raising $1.8M to reach 200 restaurant groups by the end of Year 3: 30 groups in Year 1, 90 in Year 2, 200 in Year 3. The raise funds the plan through Year 3, with $248,800 left at the end. (opens full size in a new tab)
    Slide 2 of 10: The ask
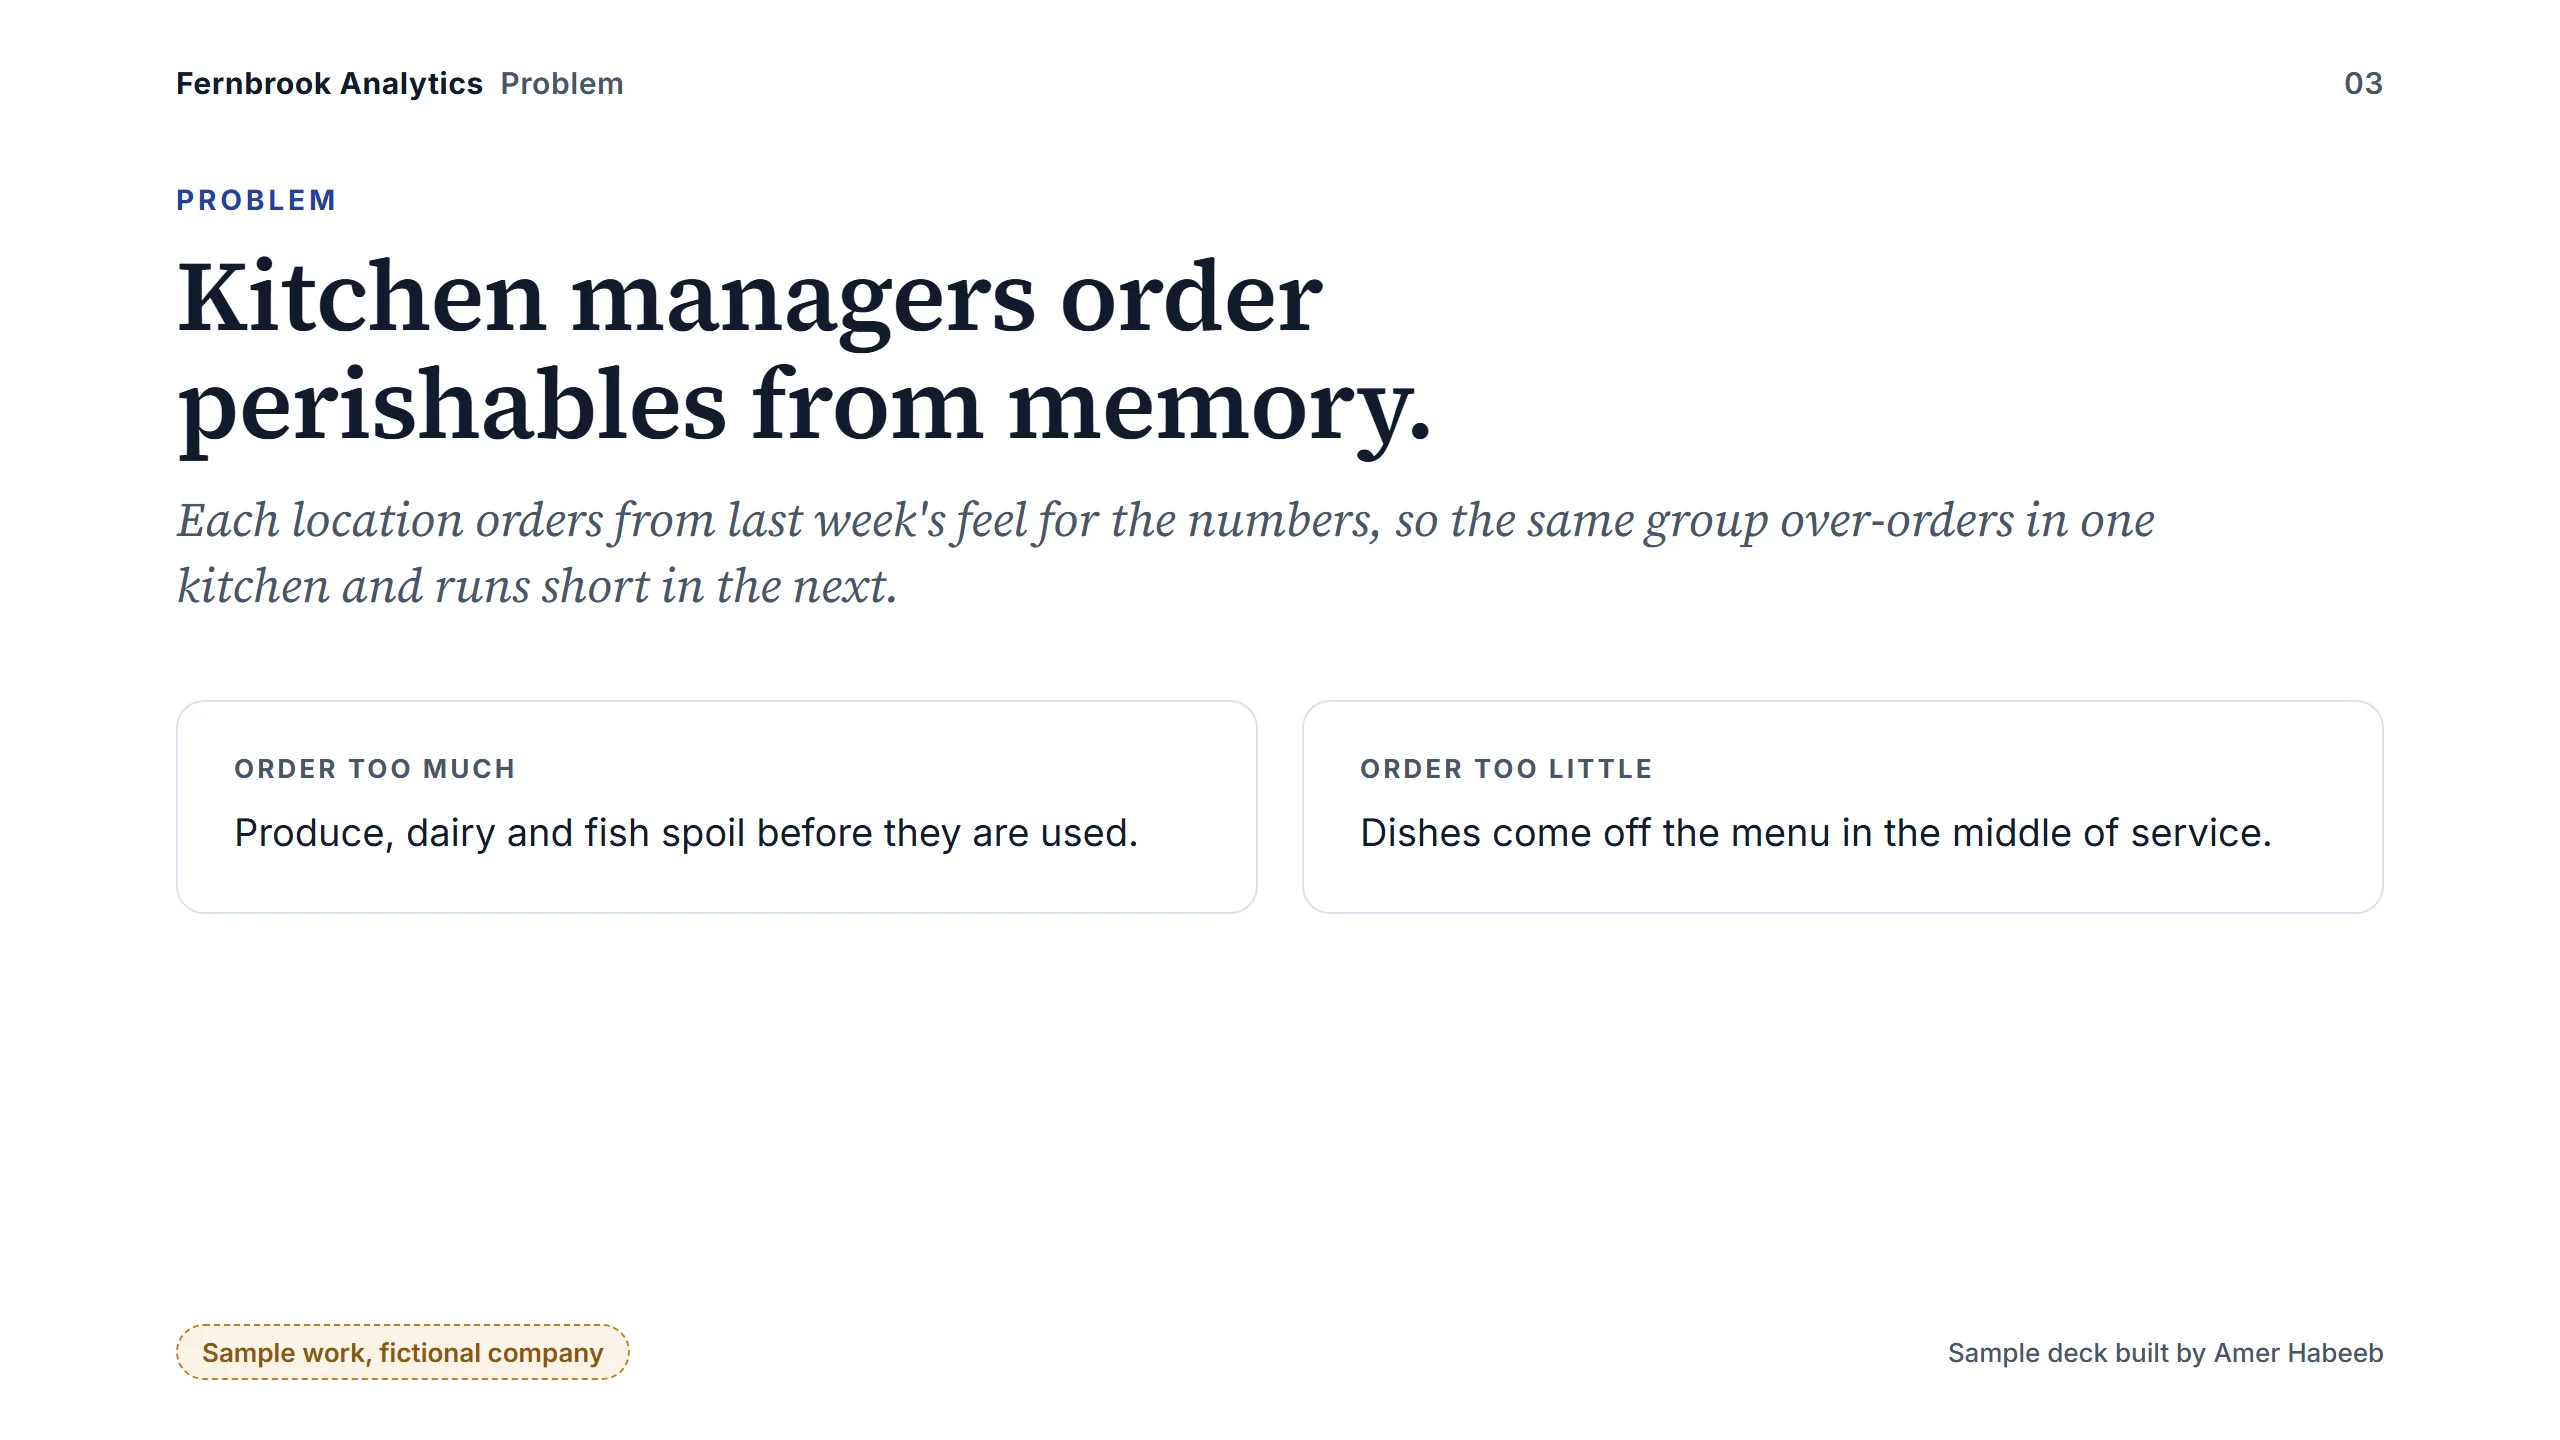
  3. Slide 3 of 10, problem. Kitchen managers order perishables from memory. Order too much and produce, dairy and fish spoil; order too little and dishes come off the menu in the middle of service. (opens full size in a new tab)
    Slide 3 of 10: Problem
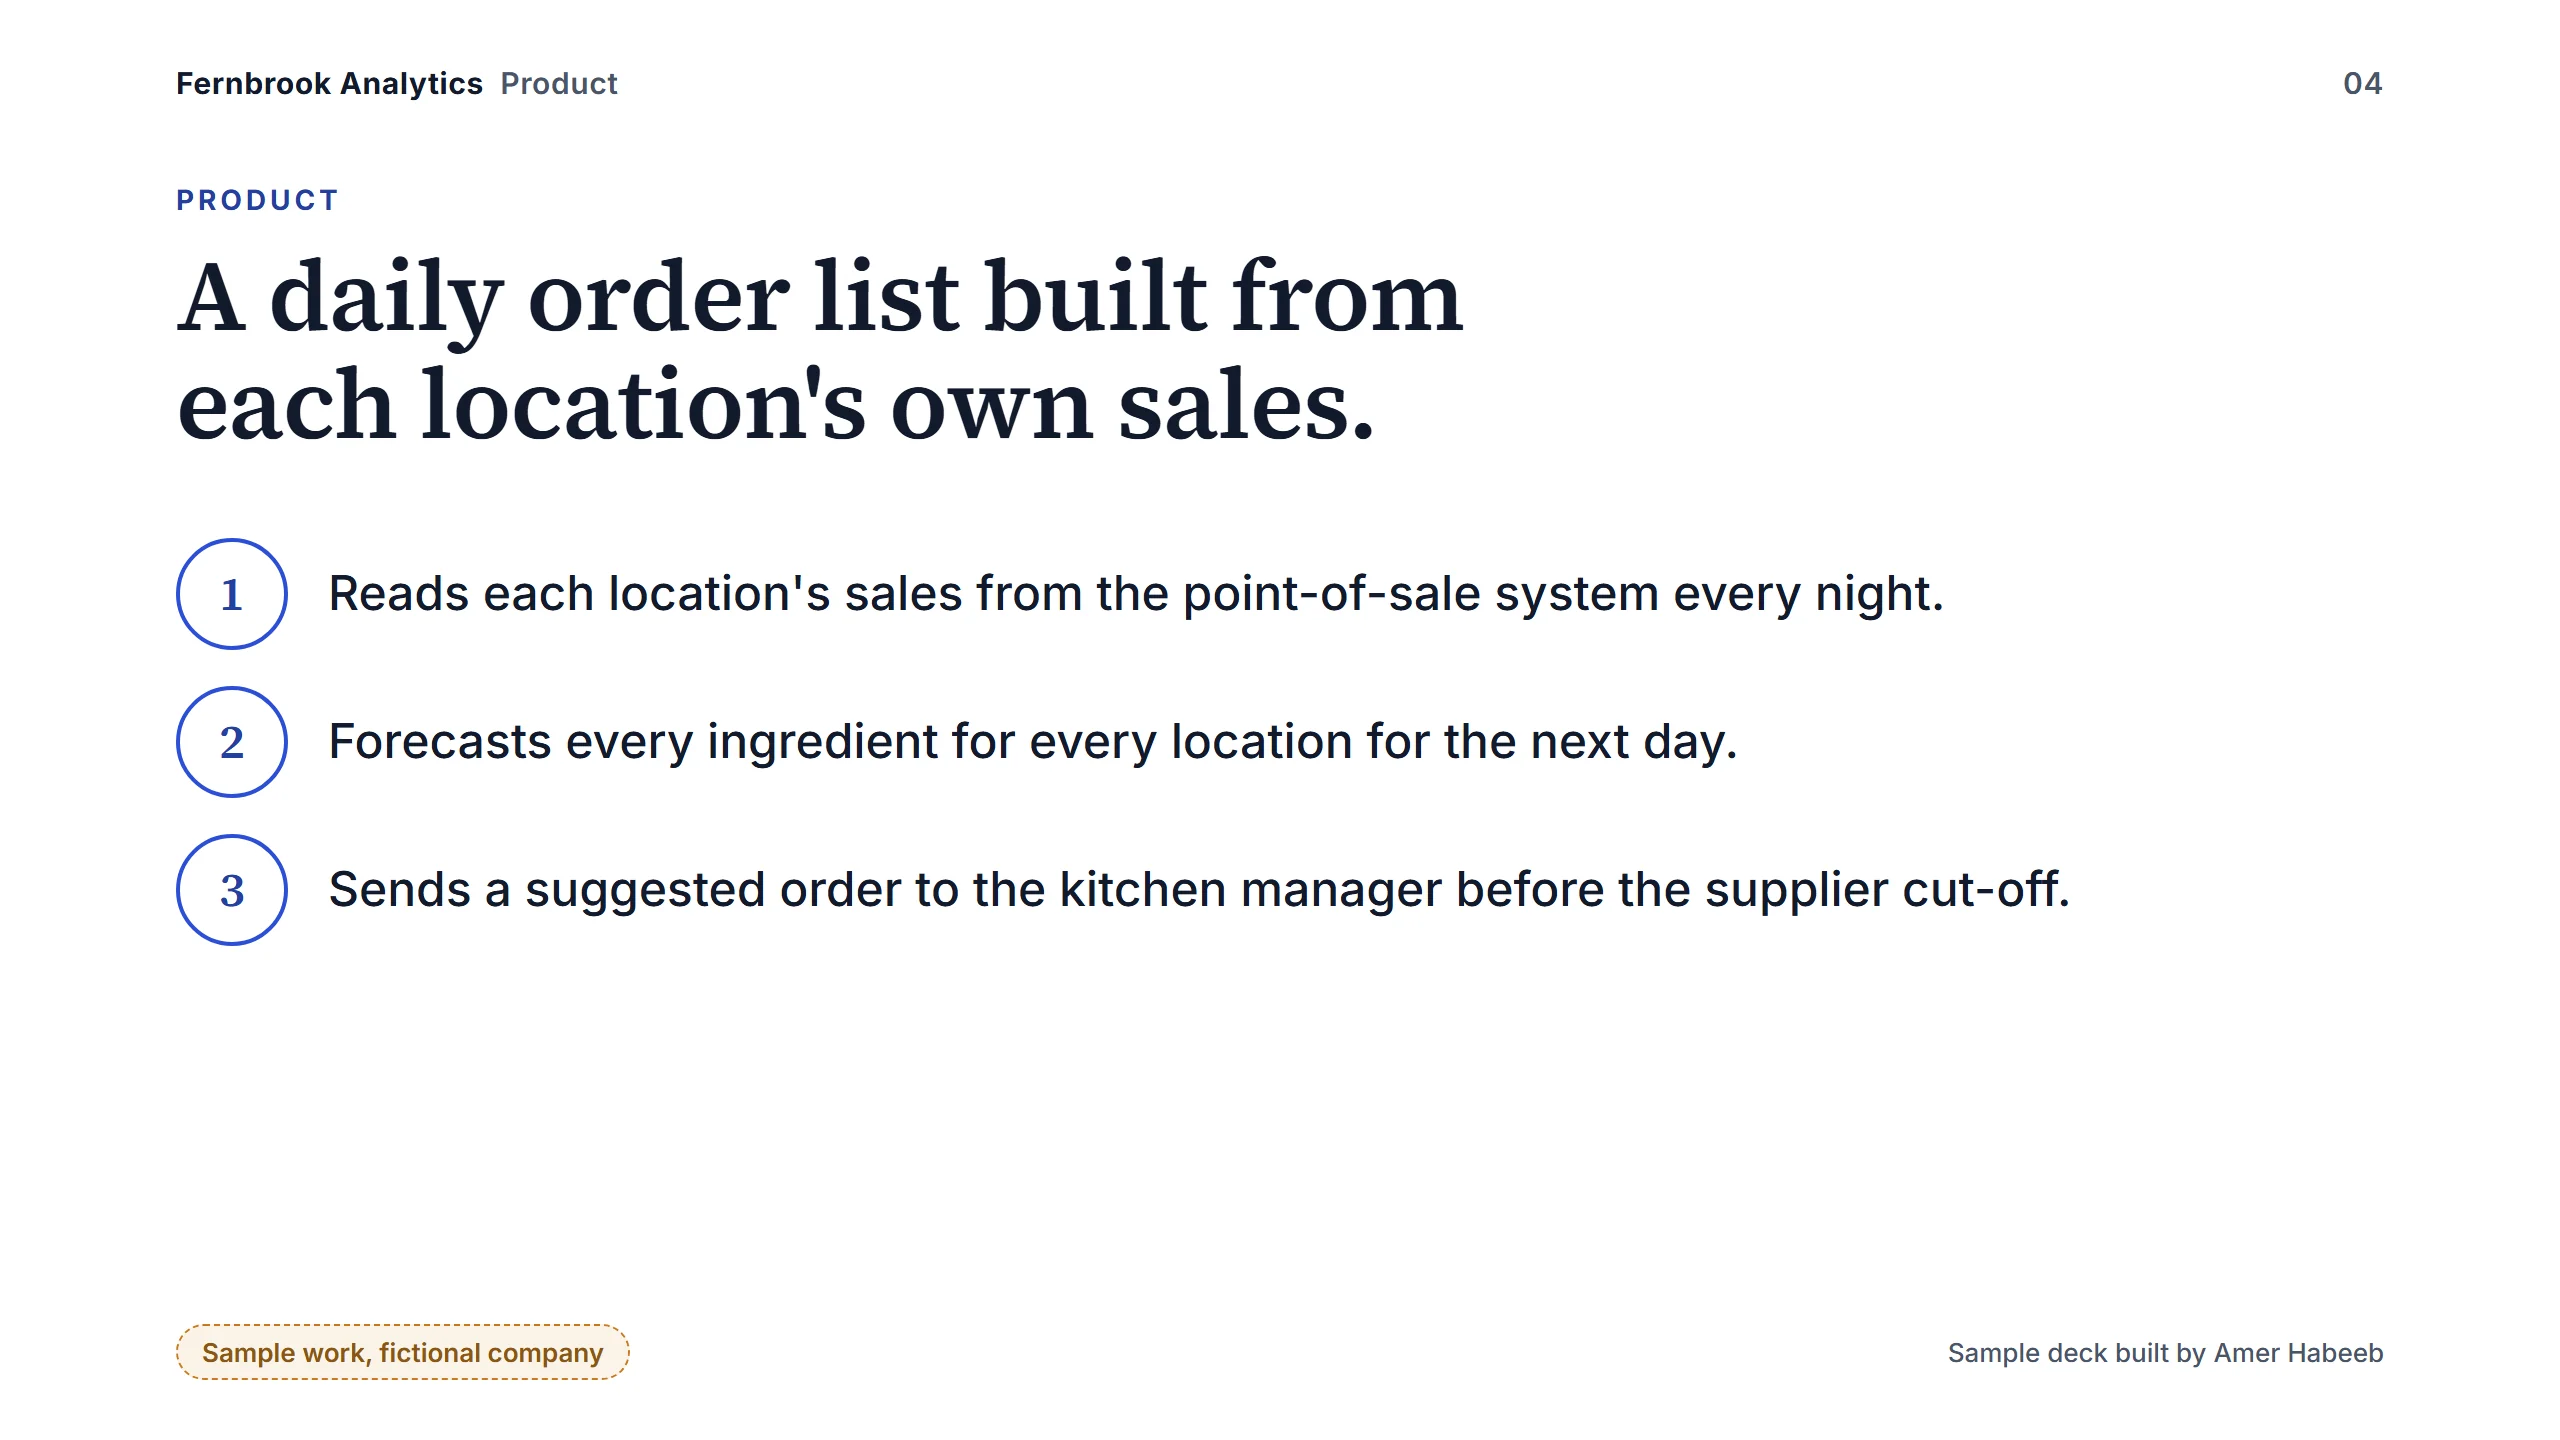
  4. Slide 4 of 10, product. A daily order list built from each location's own sales: it reads point-of-sale sales every night, forecasts every ingredient for every location for the next day, and sends a suggested order before the supplier cut-off. (opens full size in a new tab)
    Slide 4 of 10: Product
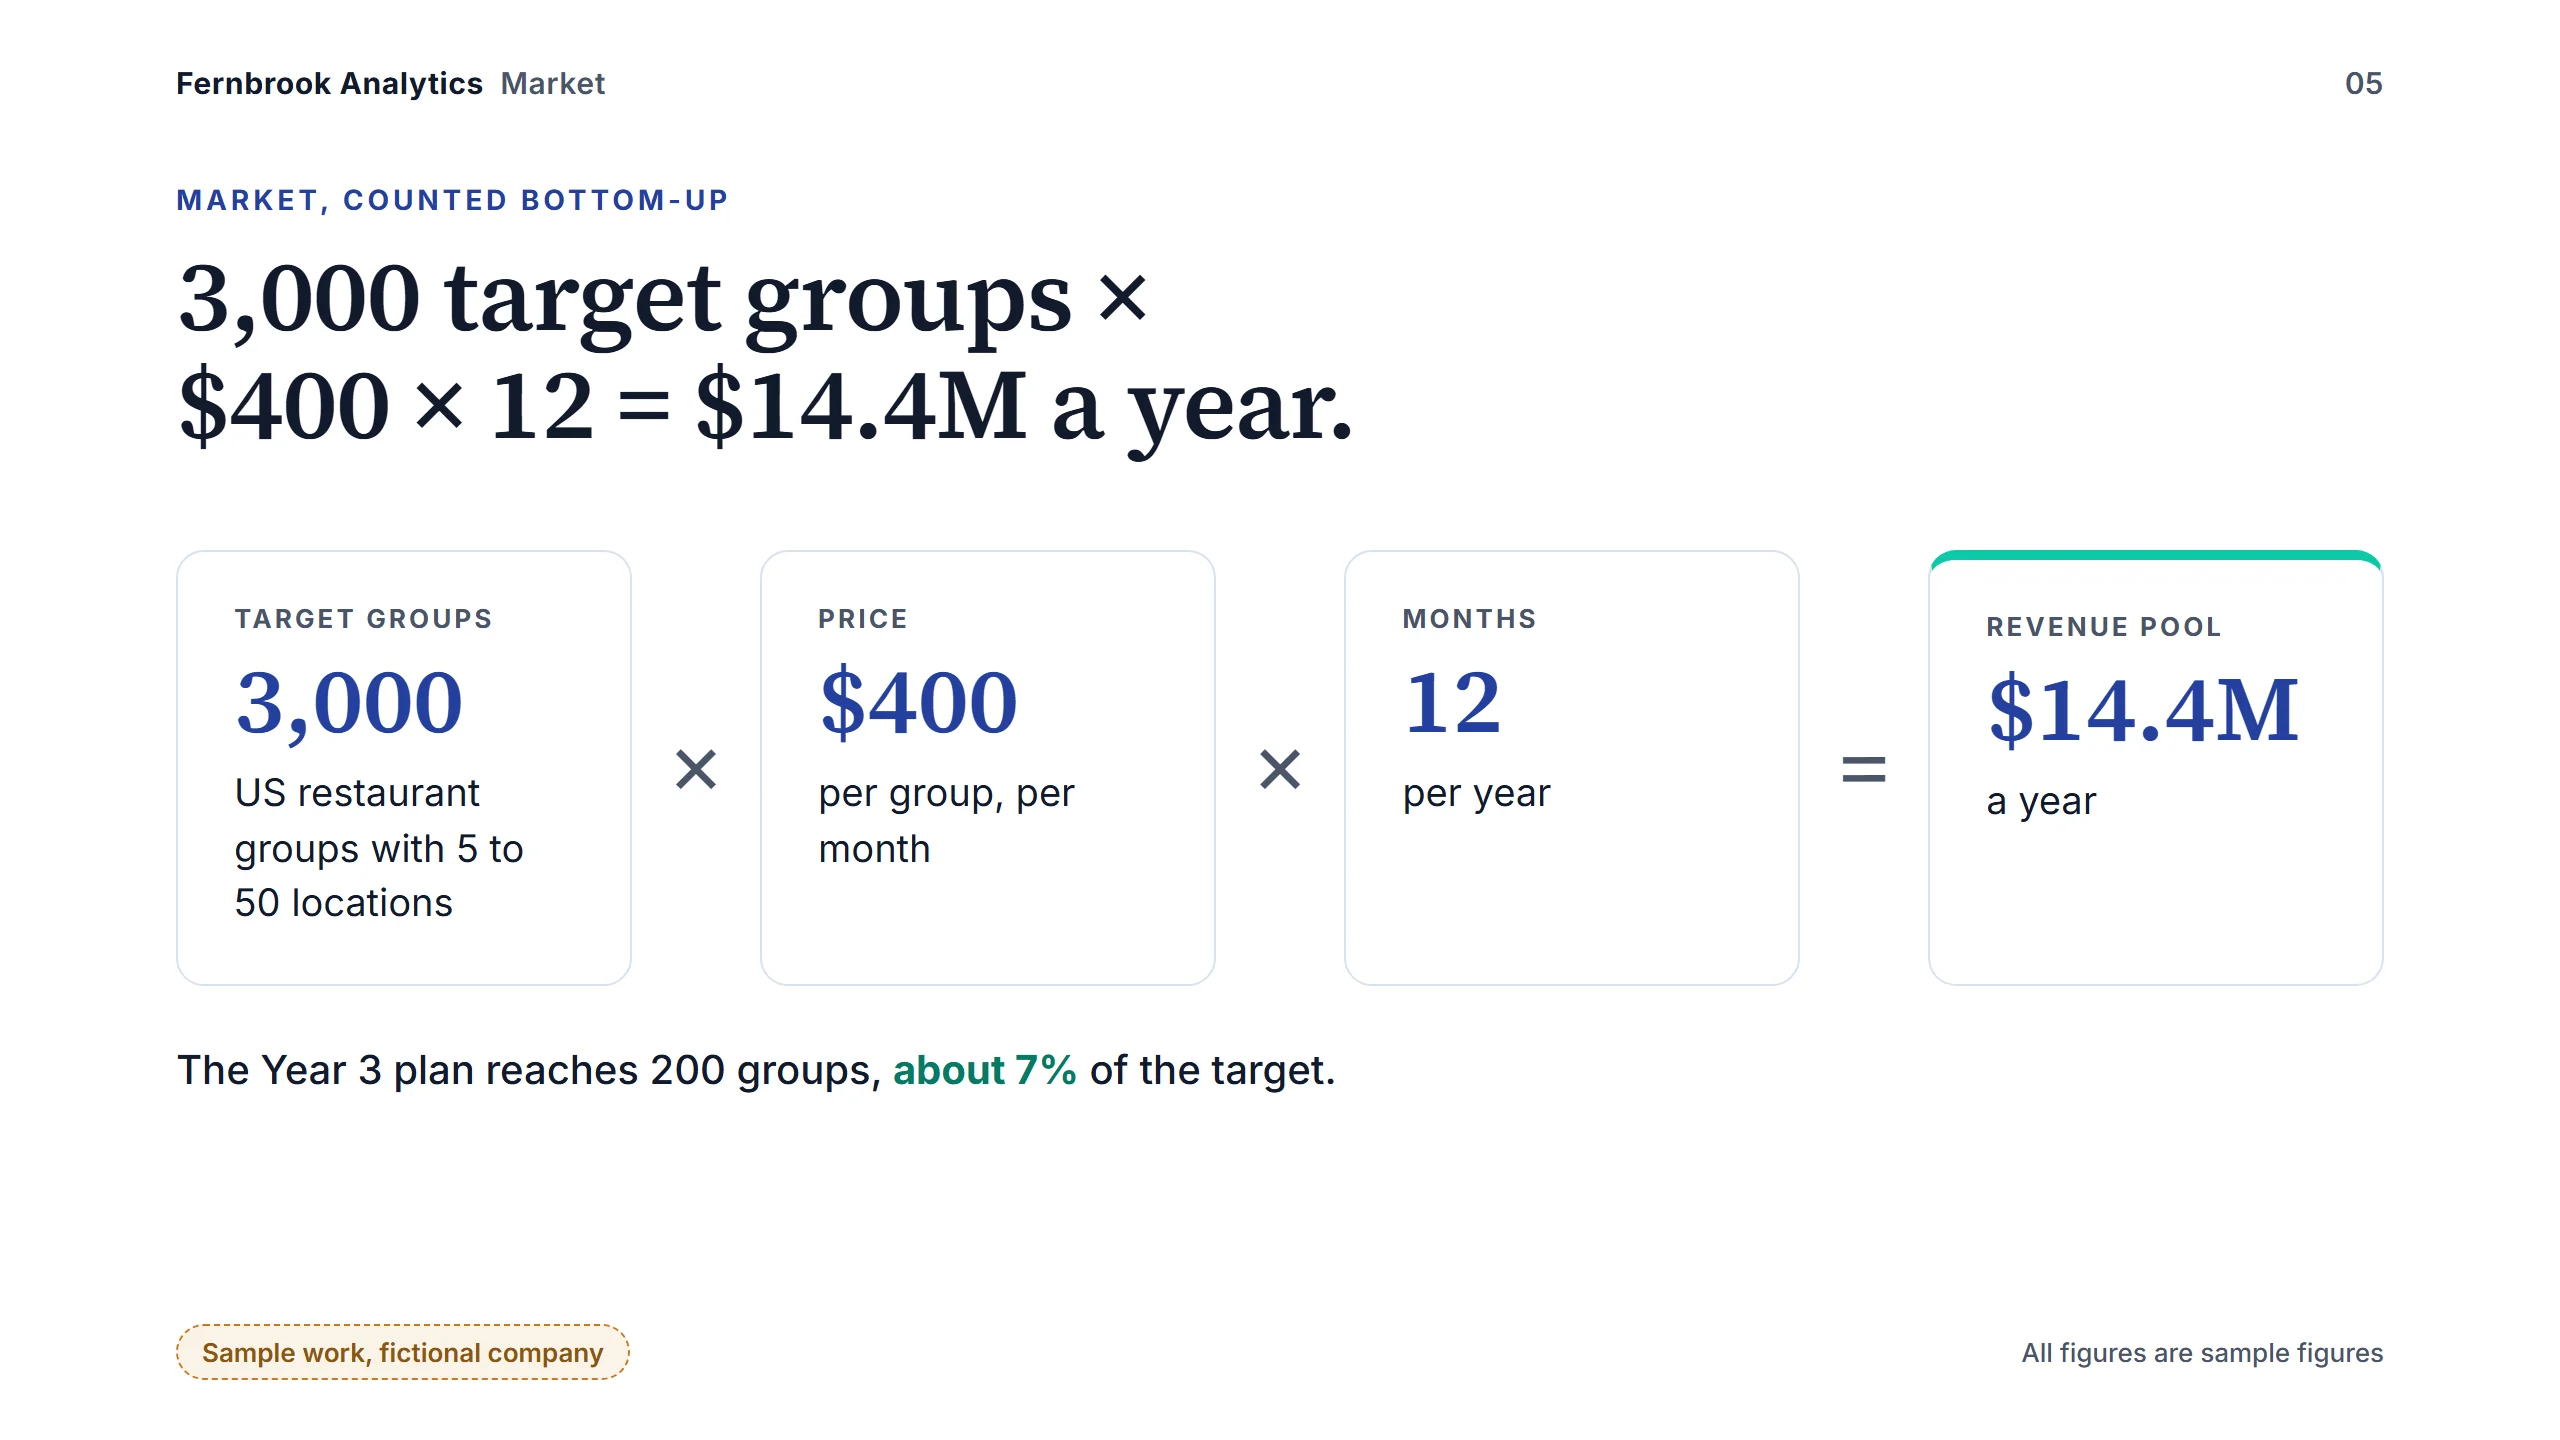
  5. Slide 5 of 10, market counted bottom-up. 3,000 target groups × $400 × 12 = $14.4M a year. The Year 3 plan reaches 200 groups, about 7% of the target. Sample figures. (opens full size in a new tab)
    Slide 5 of 10: Market, counted bottom-up
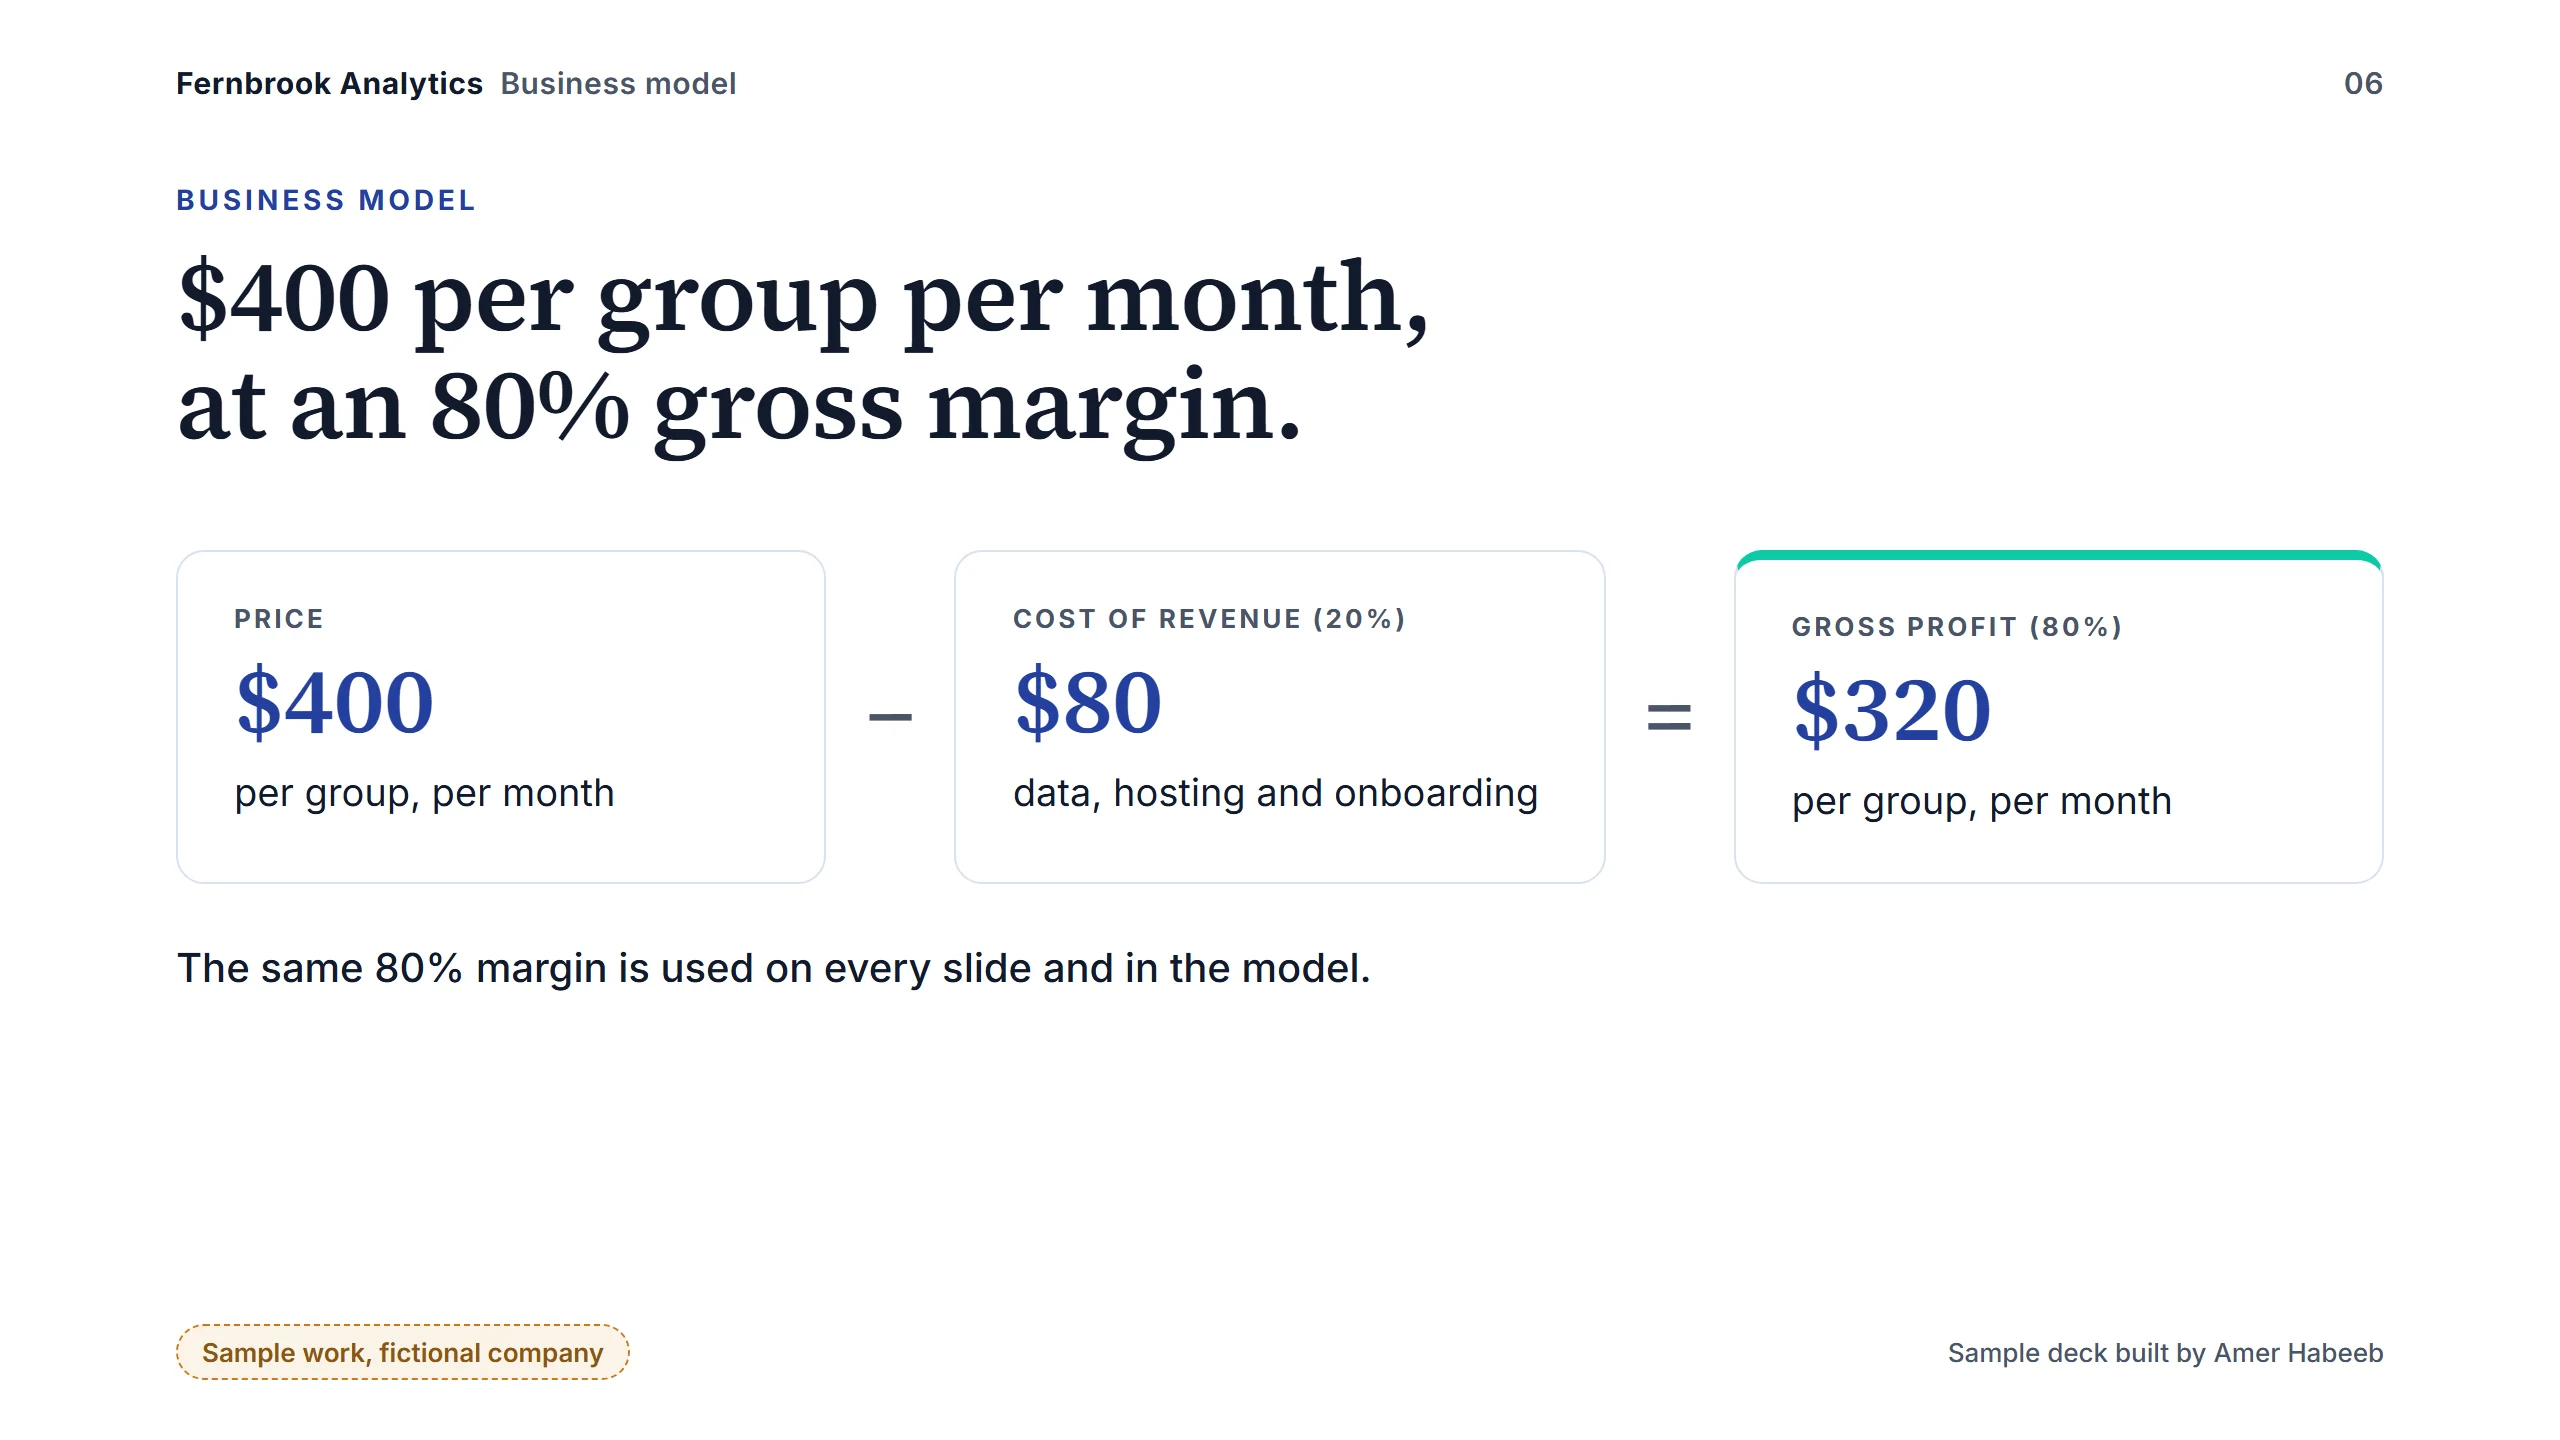
  6. Slide 6 of 10, business model. $400 per group per month, minus $80 cost of revenue (20%), leaves $320 gross profit per group per month: an 80% gross margin. (opens full size in a new tab)
    Slide 6 of 10: Business model
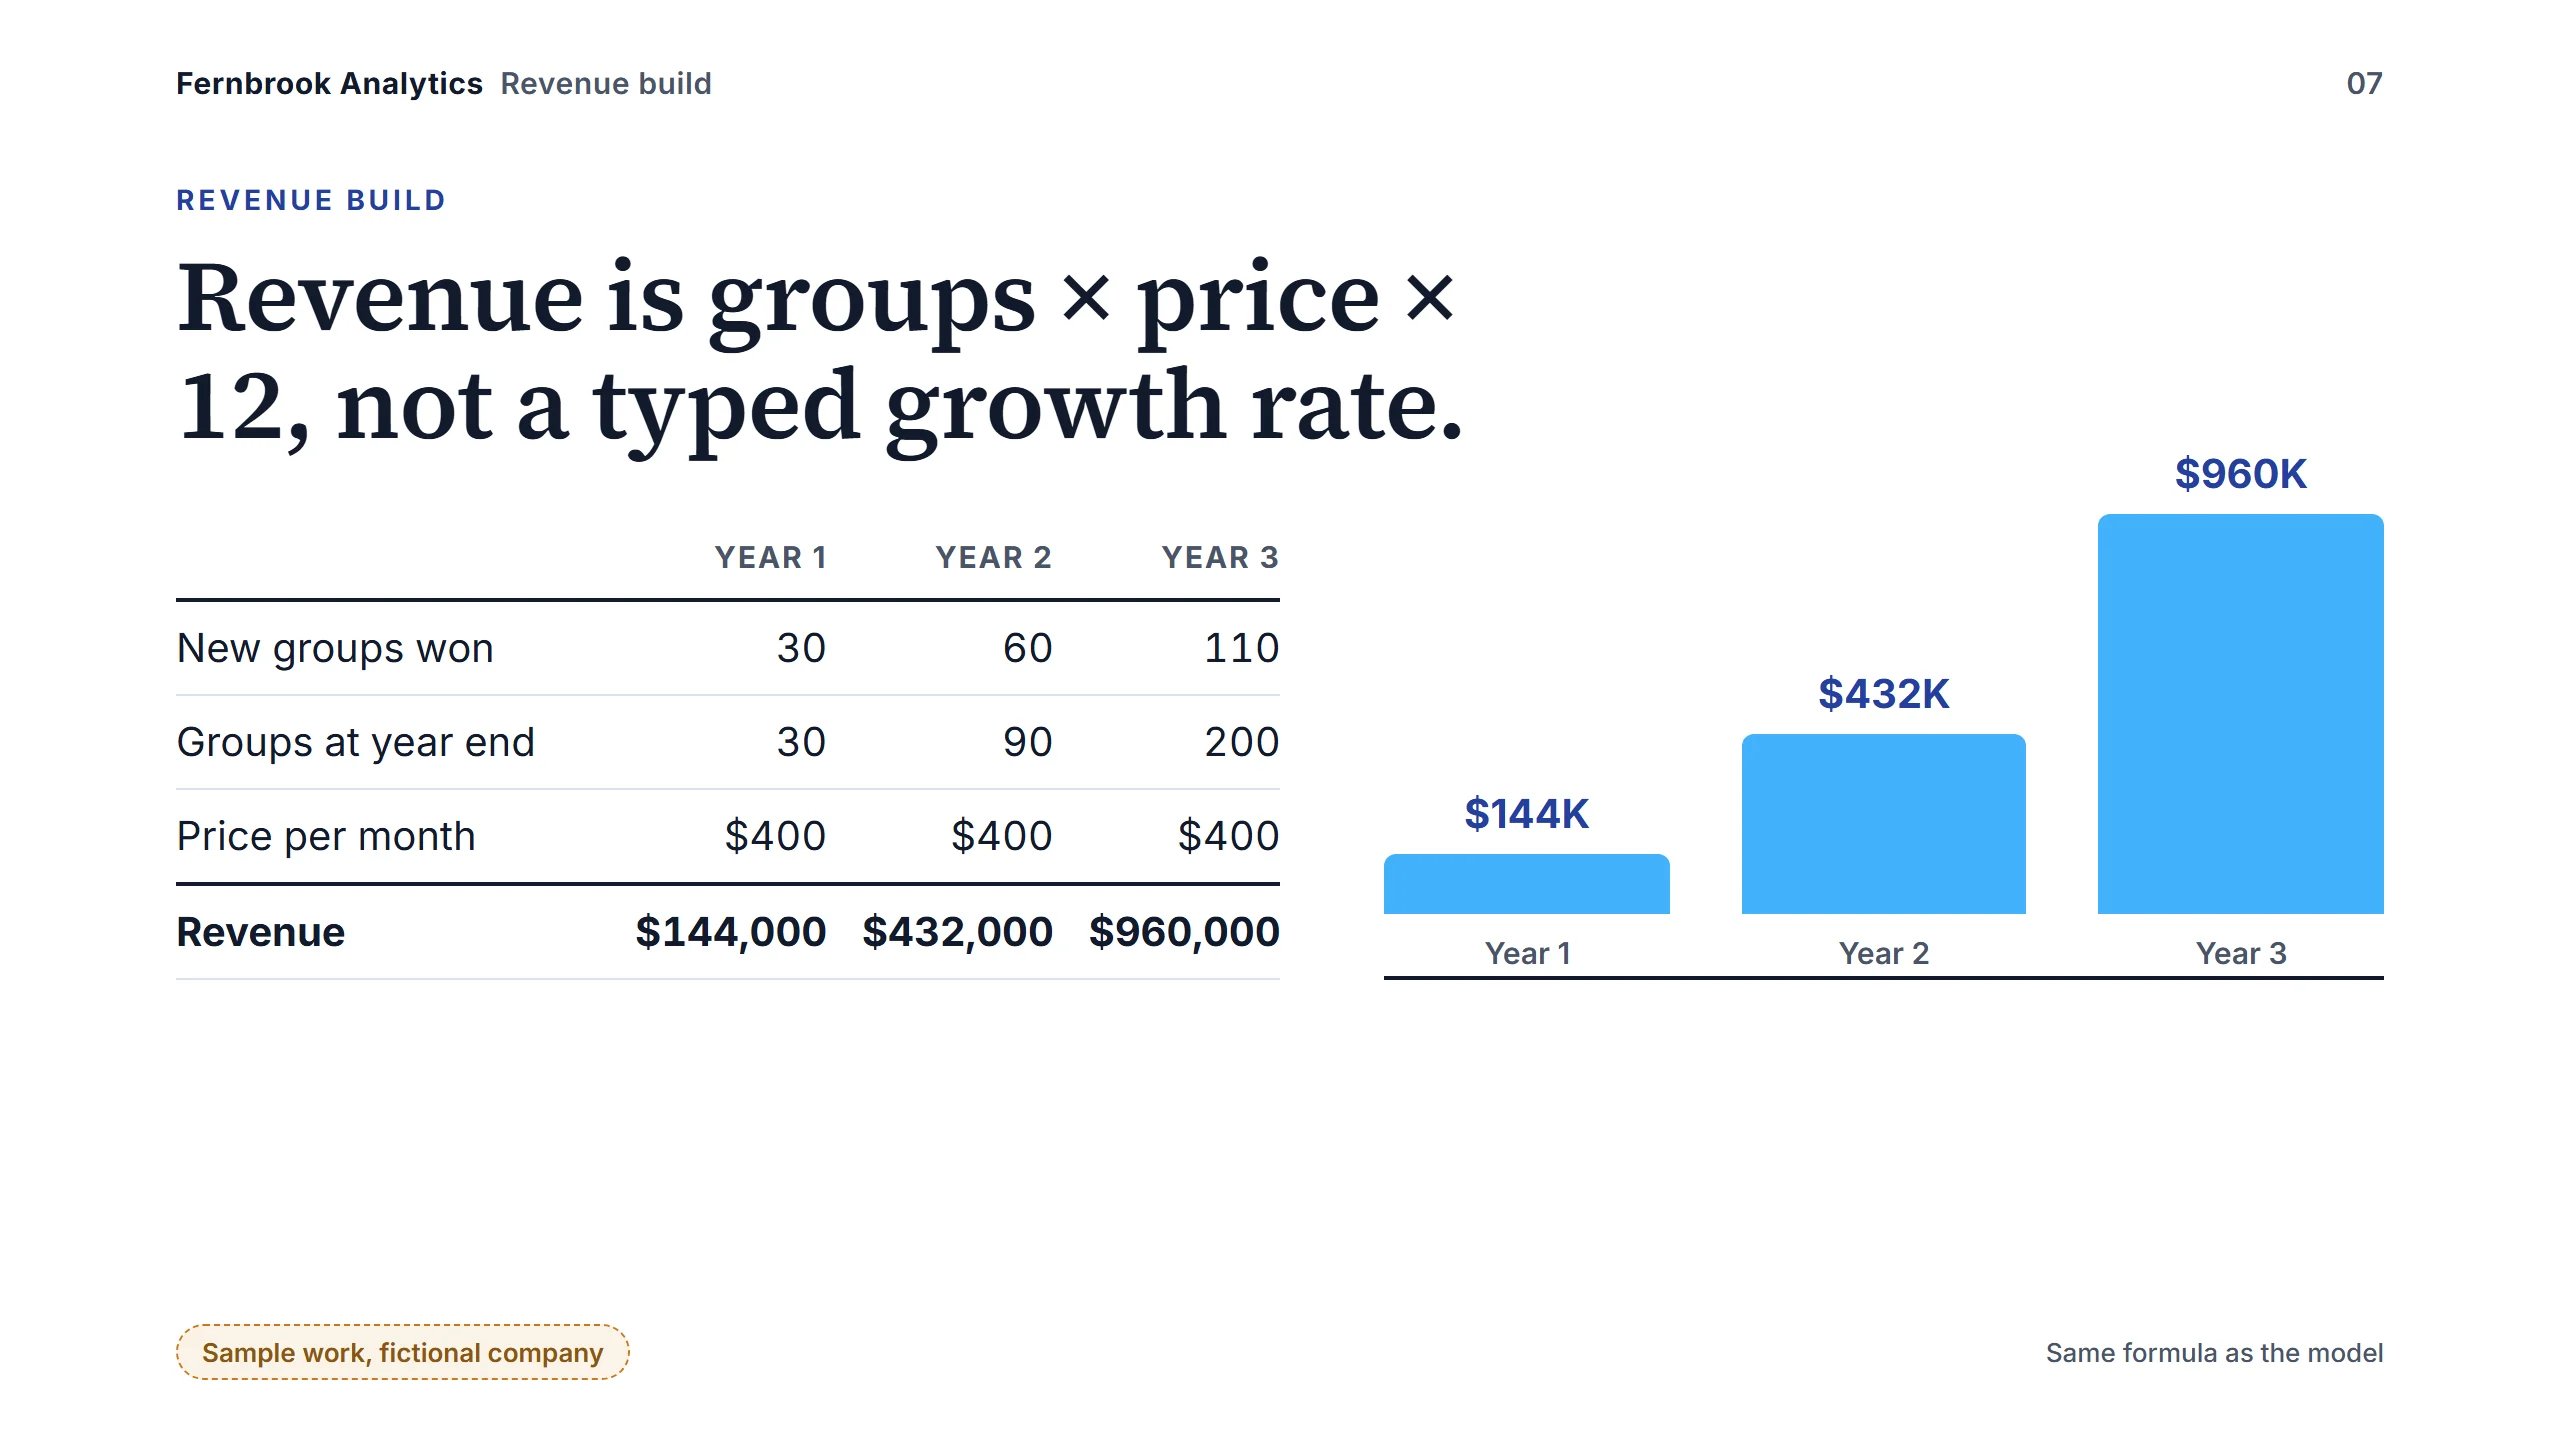
  7. Slide 7 of 10, revenue build. New groups won: 30, 60, 110. Groups at year end: 30, 90, 200. Price: $400 a month. Revenue: $144,000, $432,000 and $960,000 in Years 1 to 3. (opens full size in a new tab)
    Slide 7 of 10: Revenue build
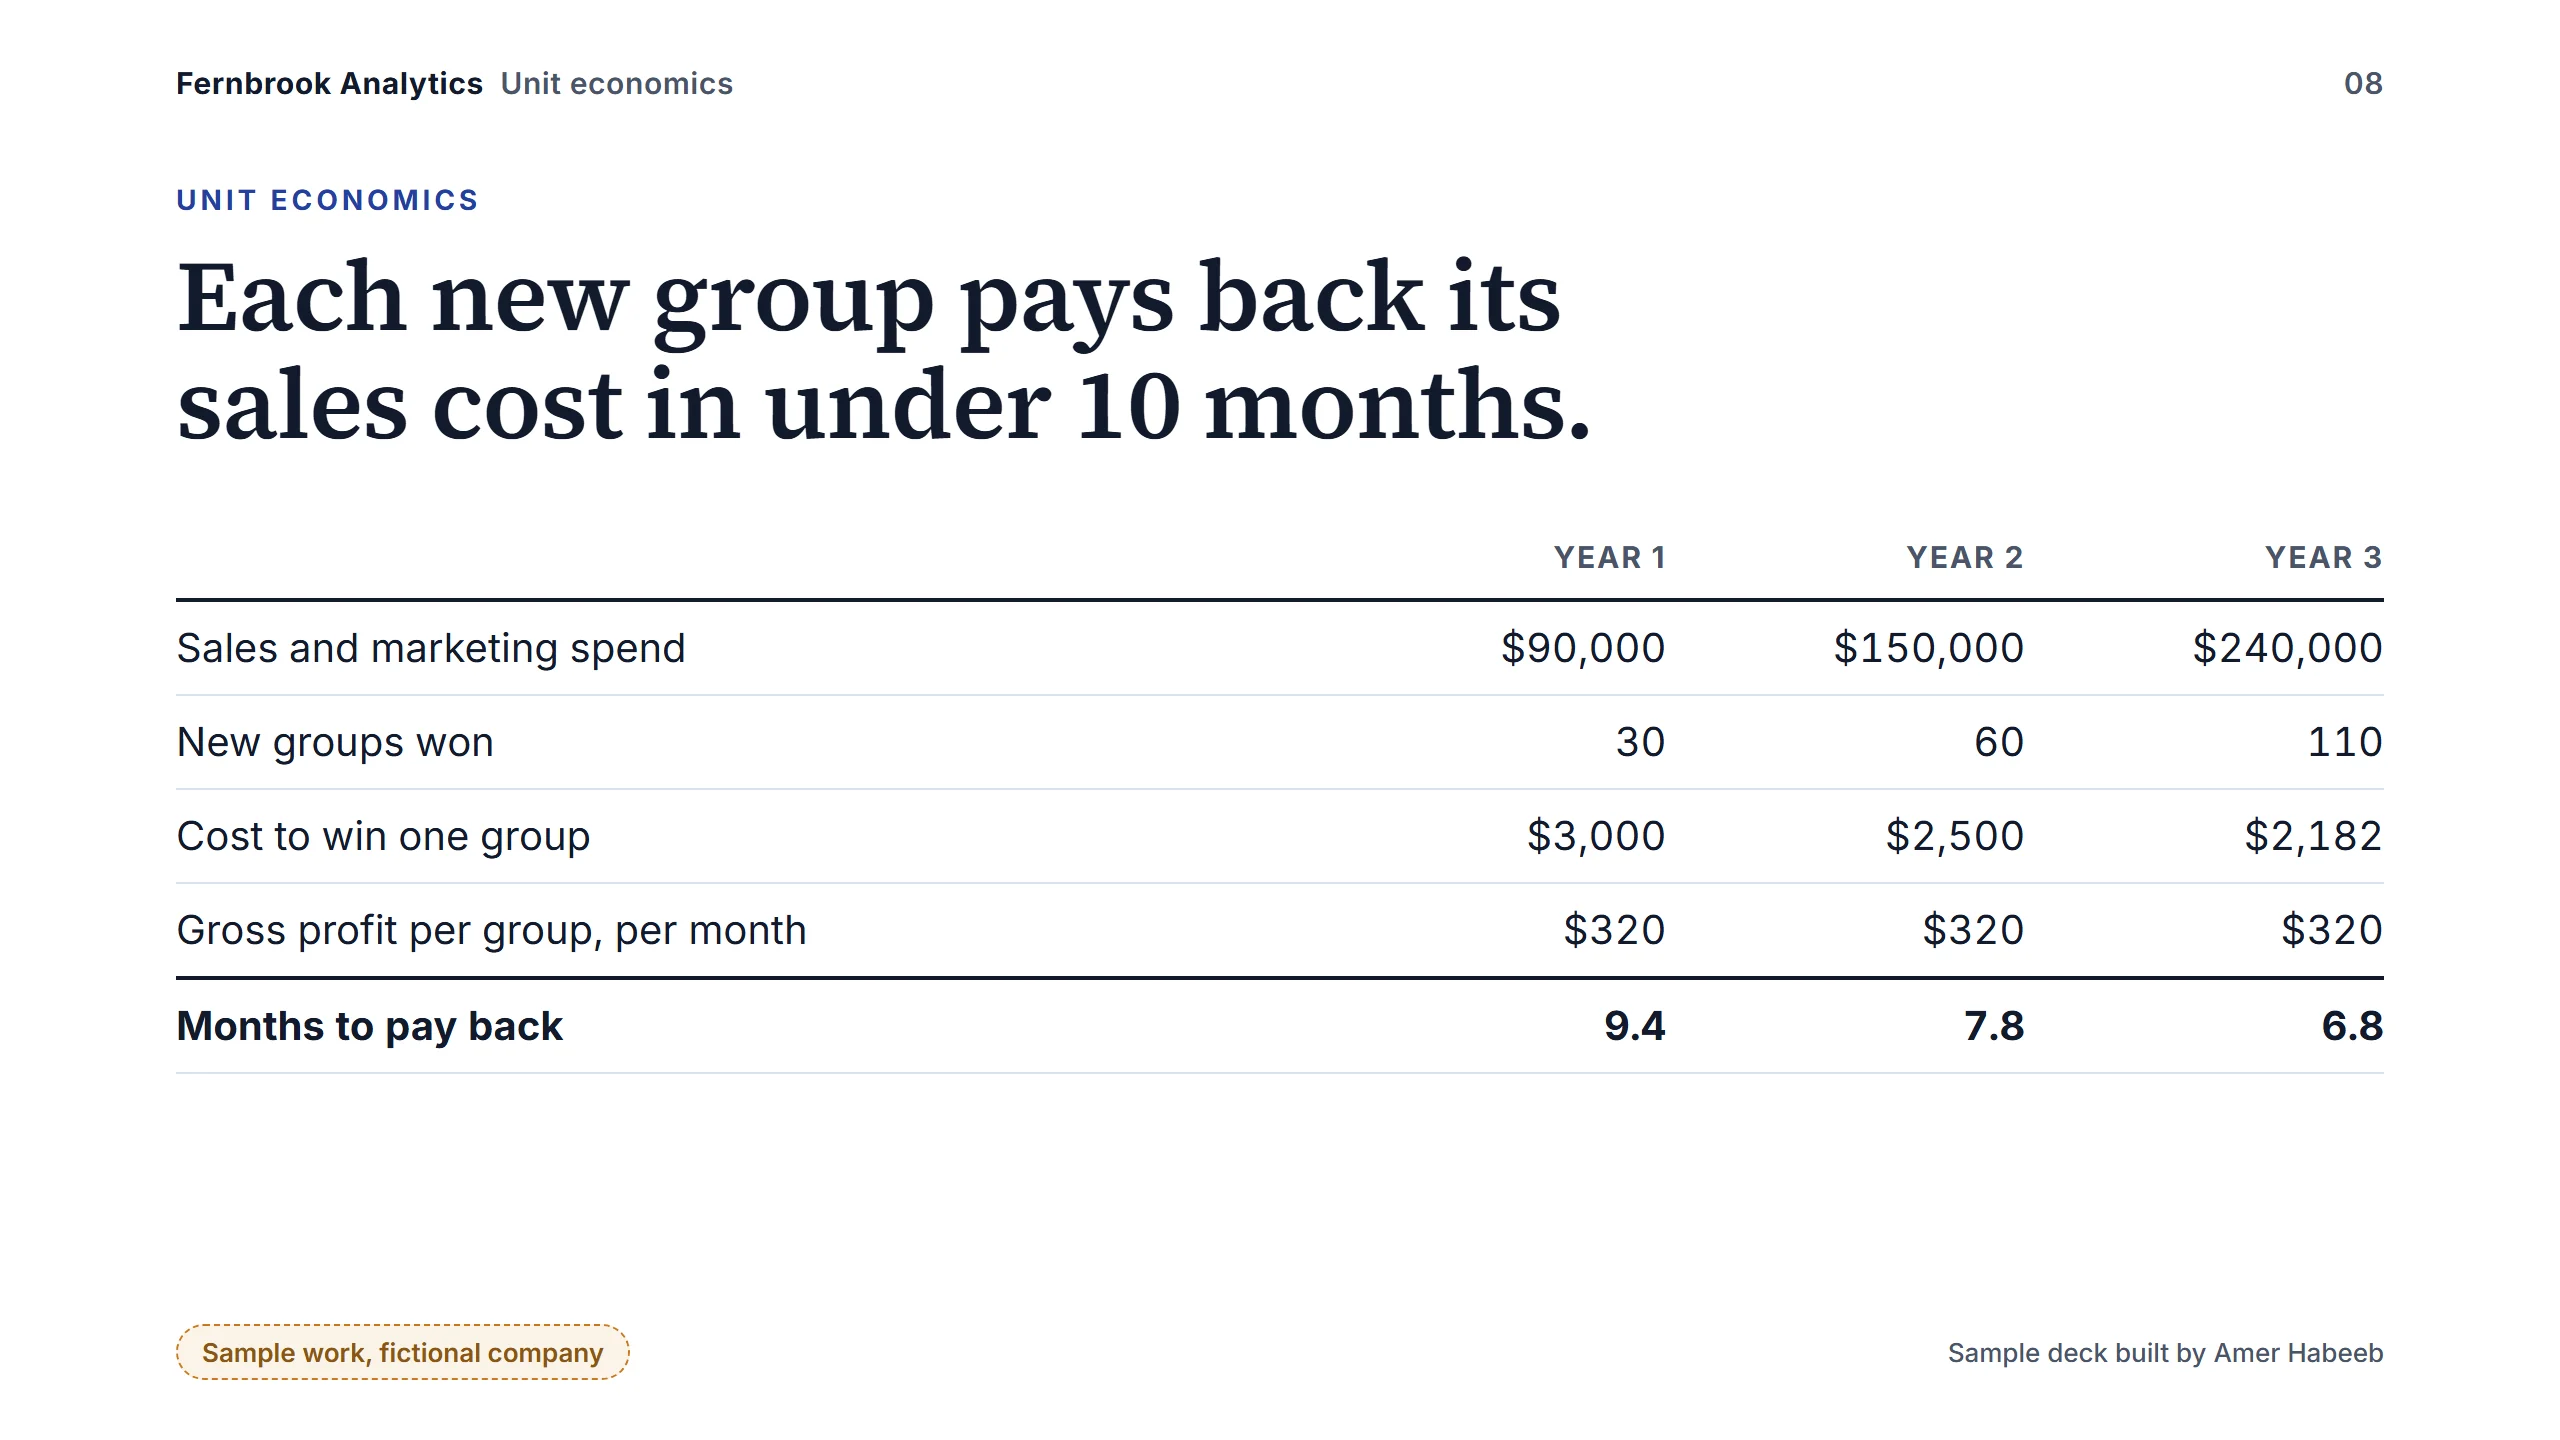
  8. Slide 8 of 10, unit economics. Sales and marketing: $90,000, $150,000, $240,000. New groups: 30, 60, 110. Cost to win one group: $3,000, $2,500, $2,182. Months to pay back at $320 gross profit a month: 9.4, 7.8, 6.8. (opens full size in a new tab)
    Slide 8 of 10: Unit economics
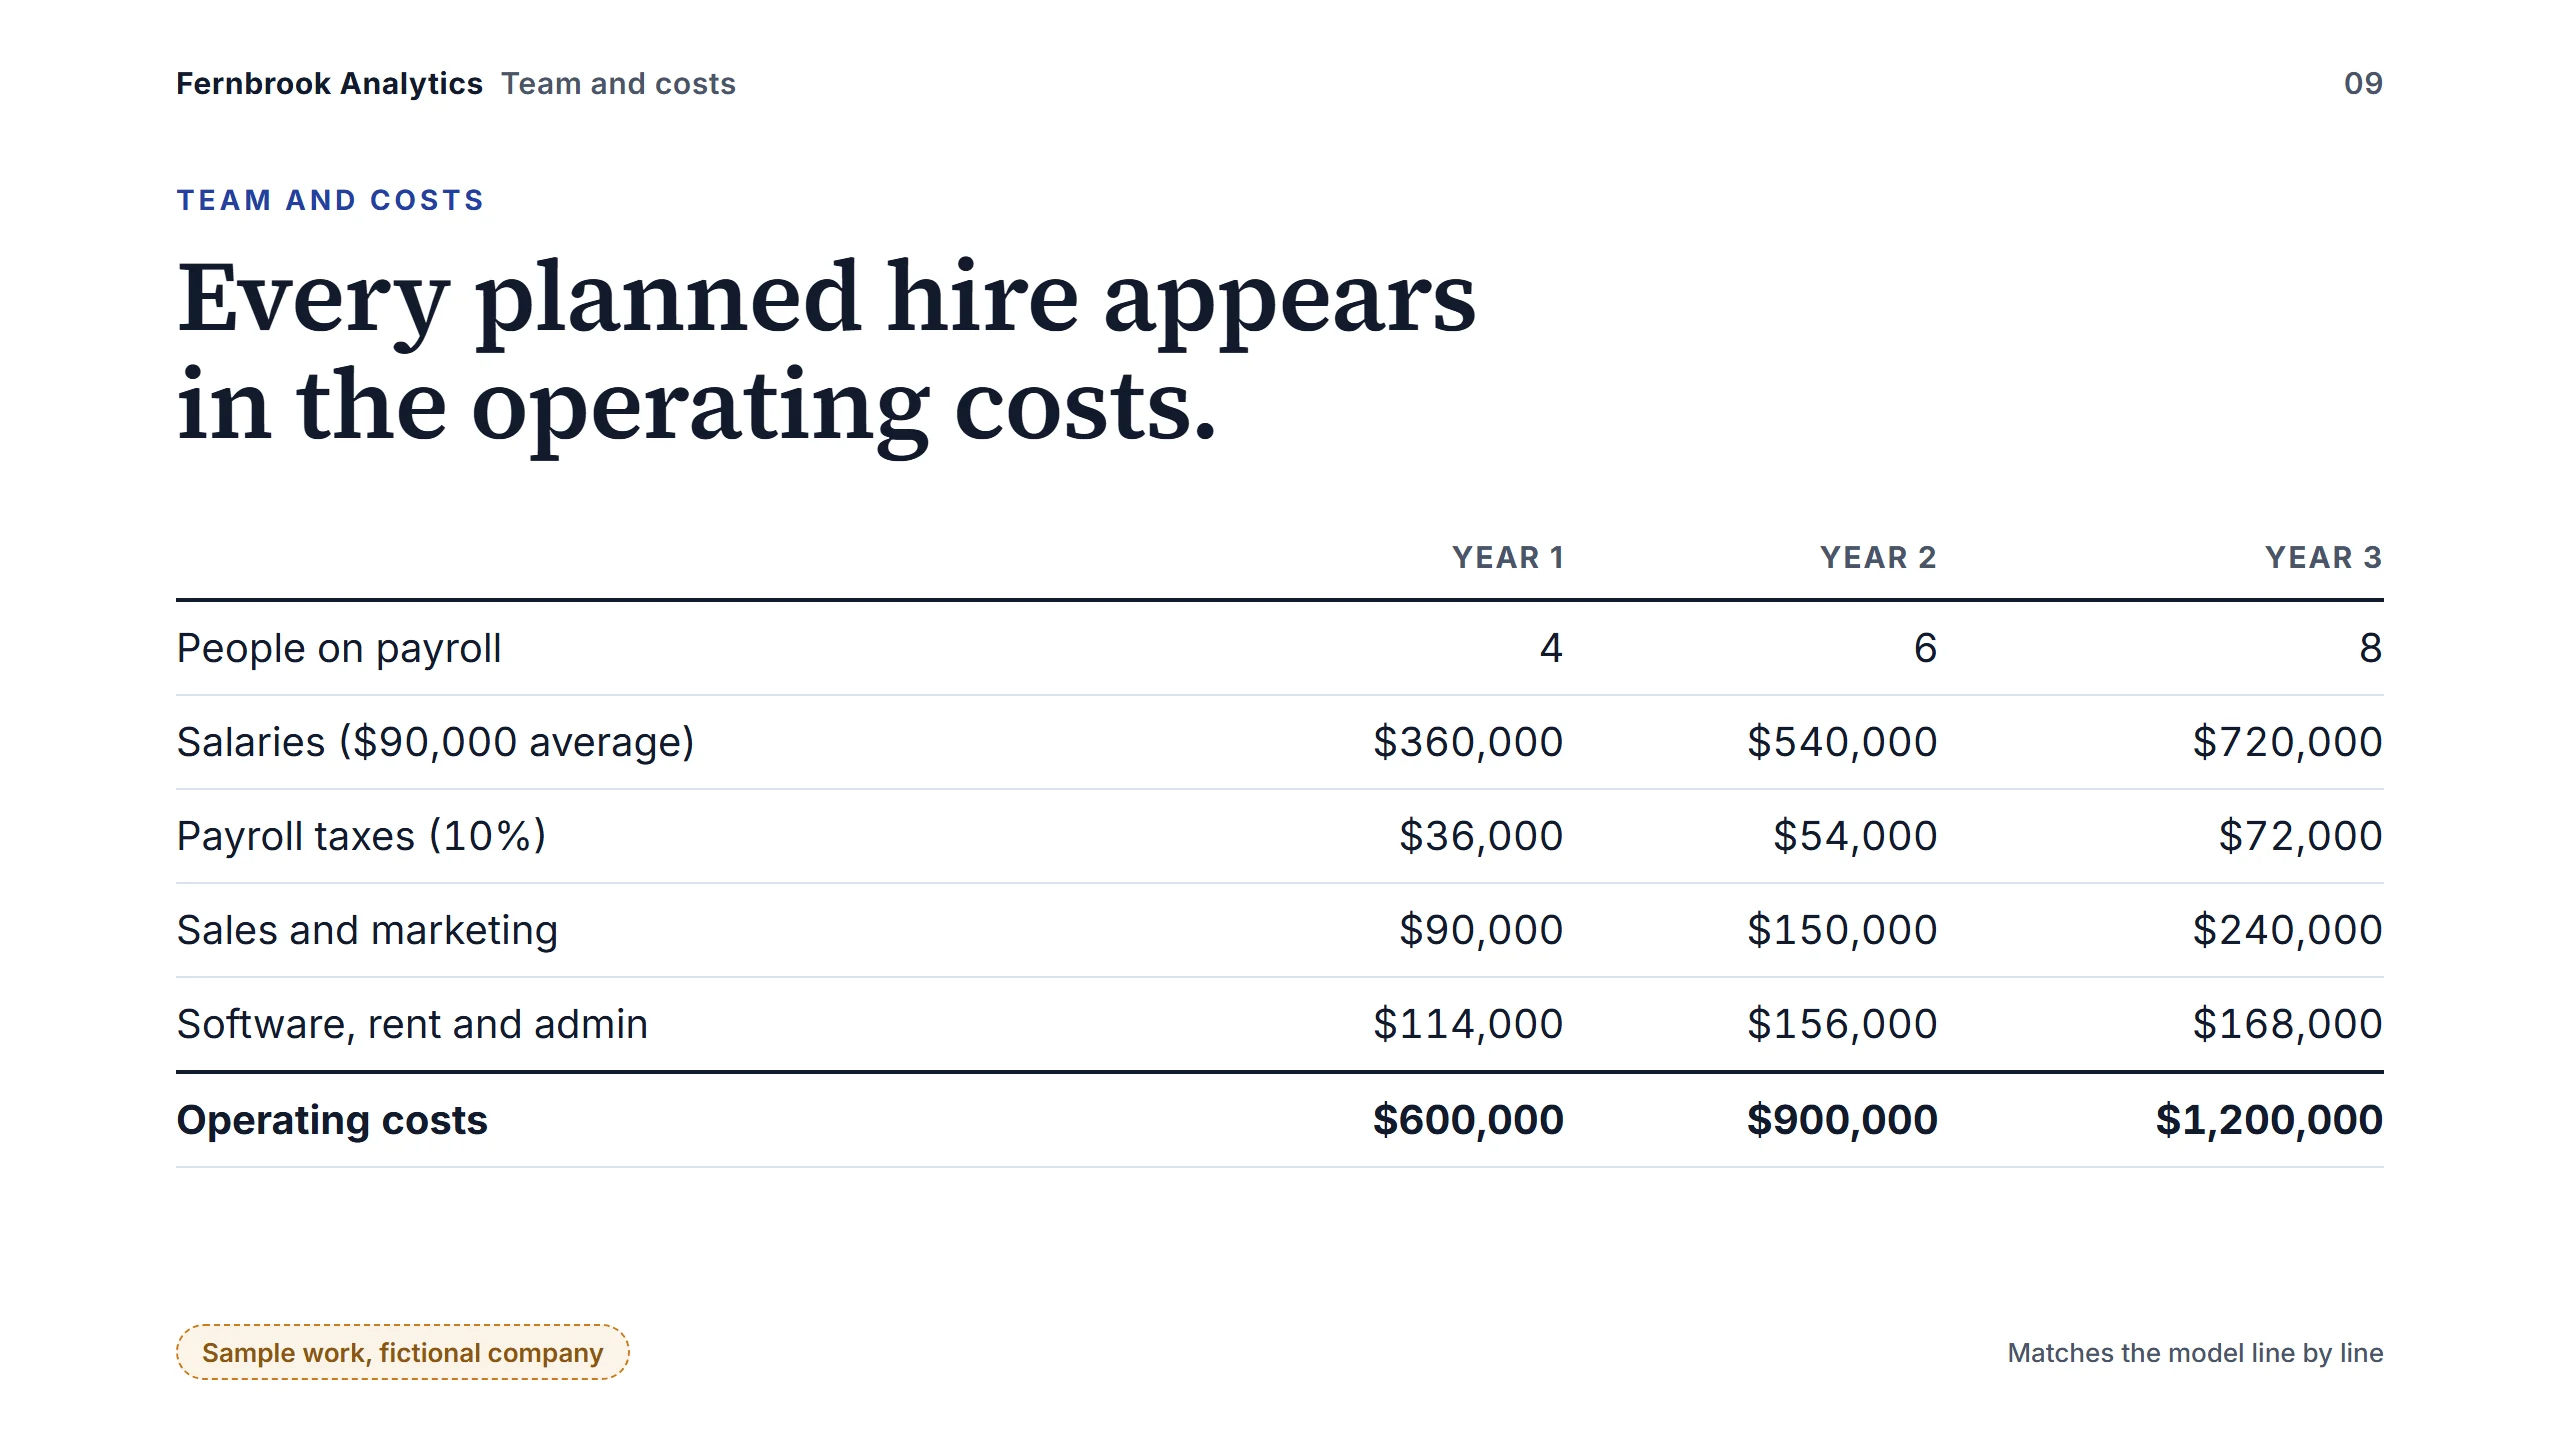
  9. Slide 9 of 10, team and costs. People on payroll: 4, 6, 8. Salaries at a $90,000 average: $360,000, $540,000, $720,000. Payroll taxes: $36,000, $54,000, $72,000. Sales and marketing: $90,000, $150,000, $240,000. Software, rent and admin: $114,000, $156,000, $168,000. Operating costs: $600,000, $900,000, $1,200,000. (opens full size in a new tab)
    Slide 9 of 10: Team and costs
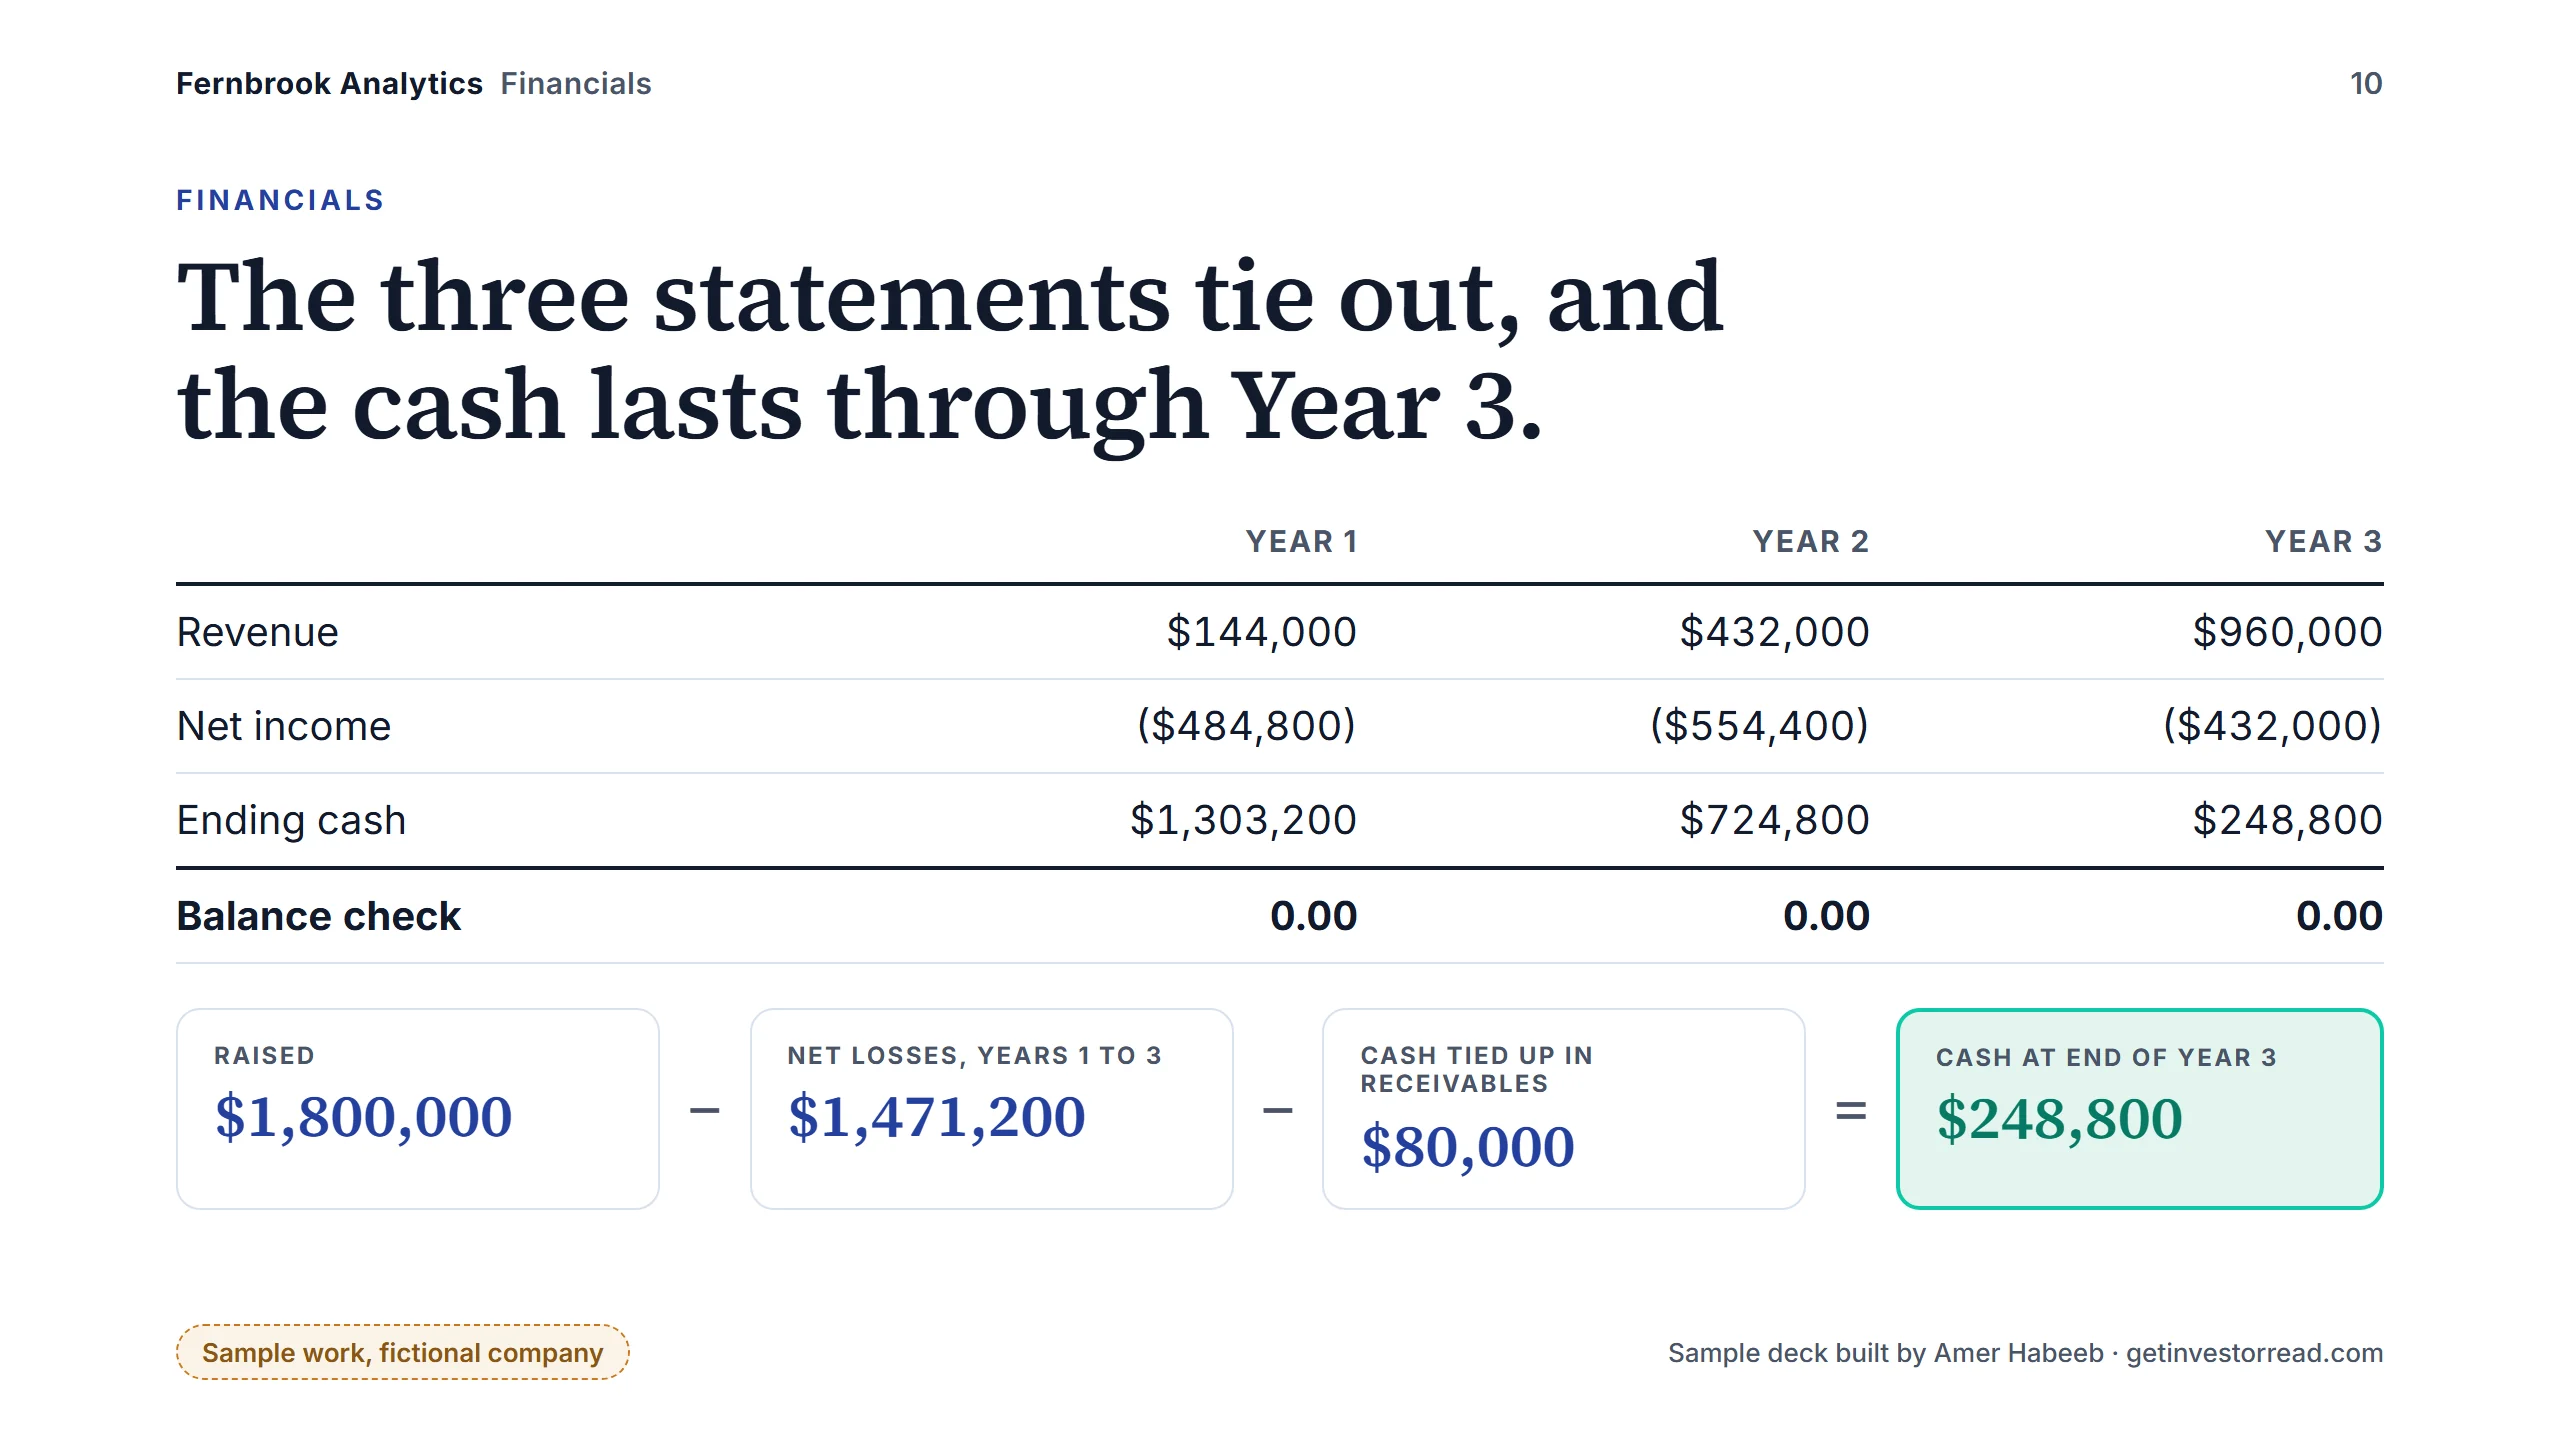
  10. Slide 10 of 10, financials. Revenue: $144,000, $432,000, $960,000. Net income: ($484,800), ($554,400), ($432,000). Ending cash: $1,303,200, $724,800, $248,800. Balance check 0.00 every year. $1,800,000 raised, minus $1,471,200 of net losses, minus $80,000 in receivables, leaves $248,800 at the end of Year 3. (opens full size in a new tab)
    Slide 10 of 10: Financials

Get my free Investor Read

Want to know what an investor would ask about your deck? The read is free.