Sample deck and model

Sample seed deck: Hearthfold (fictional company)

Sample work, fictional company

Hearthfold is a fictional company, built to show the work. Every financial figure on its 20 slides comes from one 5-year monthly model, and the model's three statements tie out in every month.

I wrote the deck and built the model behind it. Hearthfold sells shift-filling and retention software to home care agencies. It is raising a $3.5M seed round in US dollars and sells in the US first, then the UK, Ireland and the Netherlands.

Seed round, lands Jan 2027
$3.5M
Slides, each labeled fictional
20
Monthly model, 60 months, three statements
5 years
Series A gate: $3.0M ARR and 150 agencies
Aug 2028
Runway with no Series A
23 months
Lowest cash, Aug 2028
$0.64M
To repay the sales cost of an agency
8.2 months
Revenue in 2031, EBITDA positive from Apr 2030
$27.7M

How this sample was made

  1. Step 1: The brief

    A fictional founder raising a seed round of $3.5M, with a first-draft deck and a 3-year model.

  2. Step 2: The free read

    I read the first draft the way an investor would. The deck said 81% gross margin. The model used 76%. Read the whole sample read.

  3. Step 3: The rebuild

    A new 20-slide deck. Each slide below has a note on what an investor checks and where in the model the figure lives. See the slides.

  4. Step 4: The model

    The first draft billed 76, 217 and 471 agencies for every month of each year, at $1,806 a month, so Year 3 revenue read $10,207,512. The rebuilt model runs month by month for 60 months. Try the first draft live.

  5. Step 5: The files

    The deck as a PDF and the rebuilt model in Excel, both labeled fictional. Go to the downloads.

What to look at first

All 20 slides

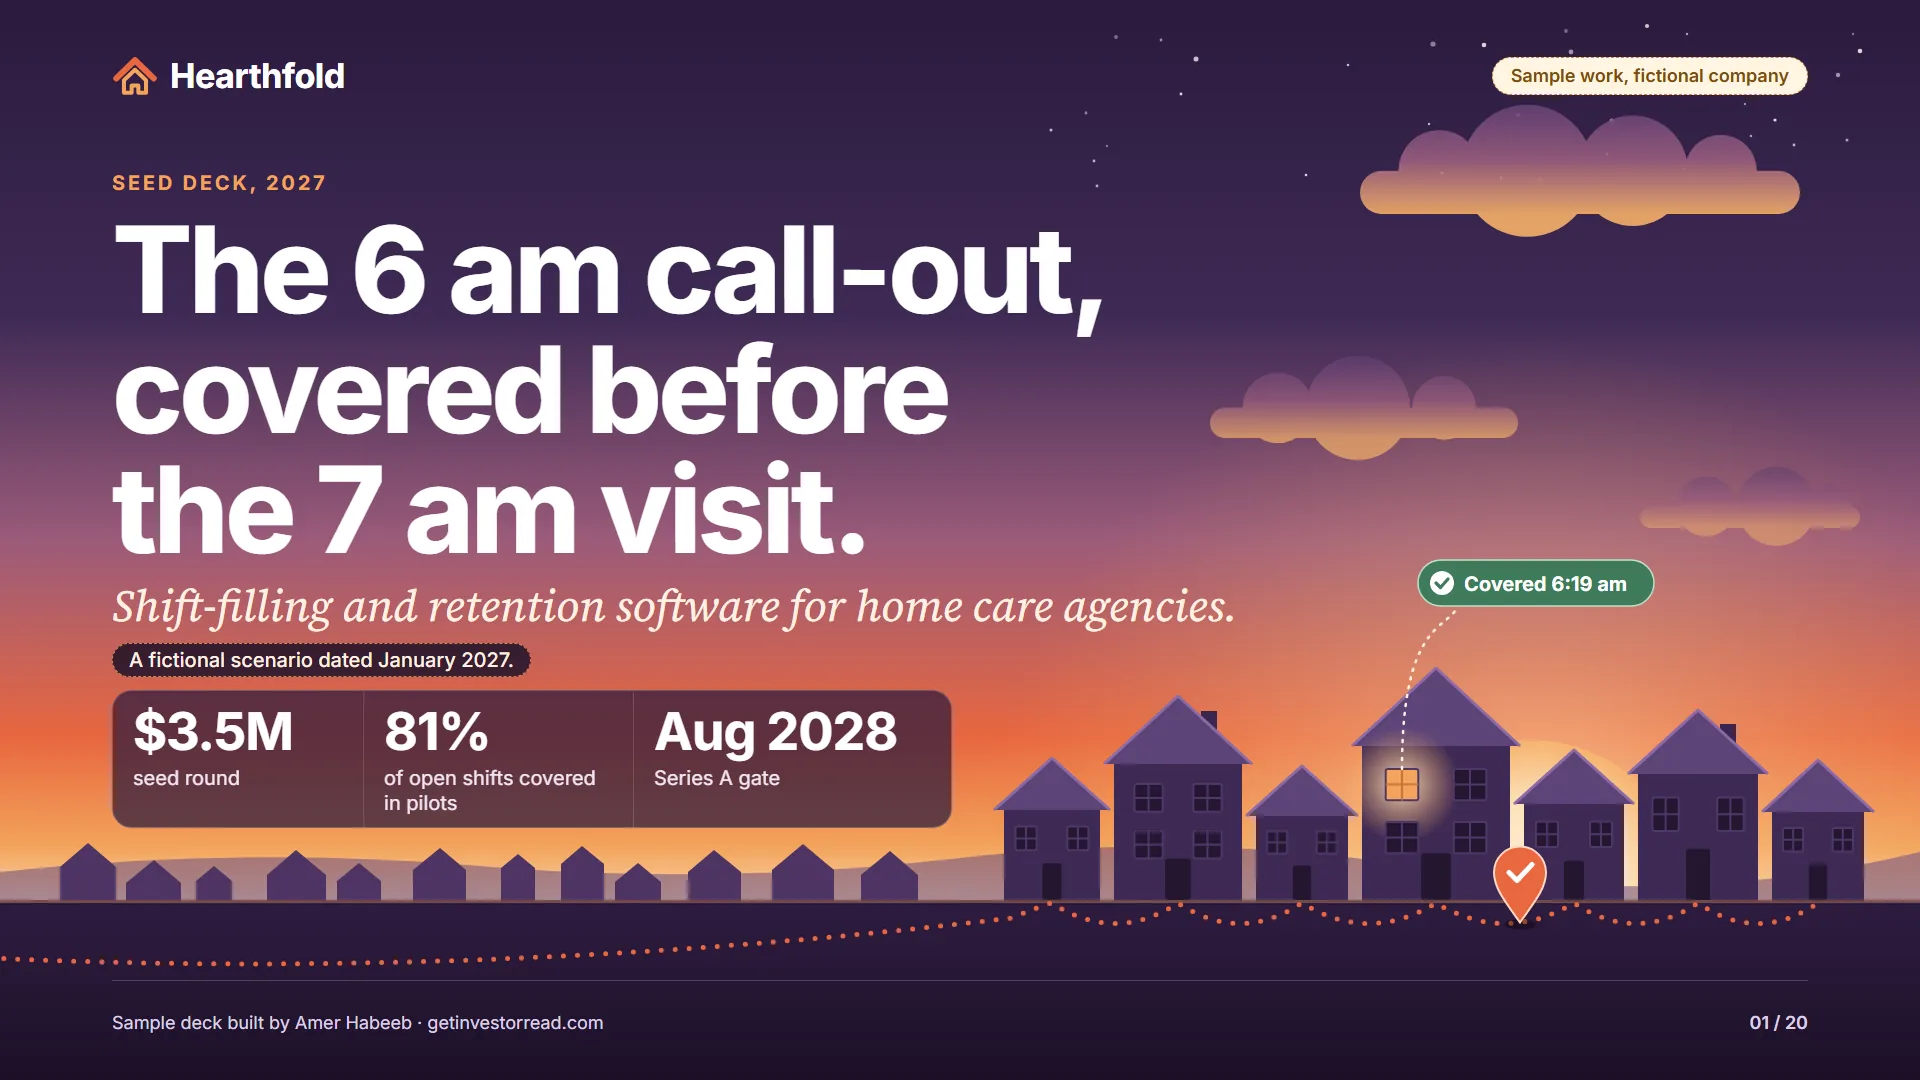
  1. Sample work, fictional company. Cover slide. Hearthfold, marked sample work, fictional company. Eyebrow: Seed deck, 2027. Headline: The 6 am call-out, covered before the 7 am visit. Tagline: Shift-filling and retention software for home care agencies. A fictional scenario dated January 2027. A drawn dawn street of seven small houses with coral dotted visit routes between them, a map pin with a check mark, and one glowing window labeled Covered 6:19 am. Stats: $3.5M seed round; 81% of open shifts covered in pilots; Series A gate Aug 2028. (opens full size in a new tab)
    Slide 1 of 20: CoverWhy it works. An investor sees the size of the conversation before the story: a $3.5M seed, 81% of open shifts covered in pilots and a Series A gate in Aug 2028. The seed is an input on the Assumptions tab; the gate month is read off the Monthly tab.
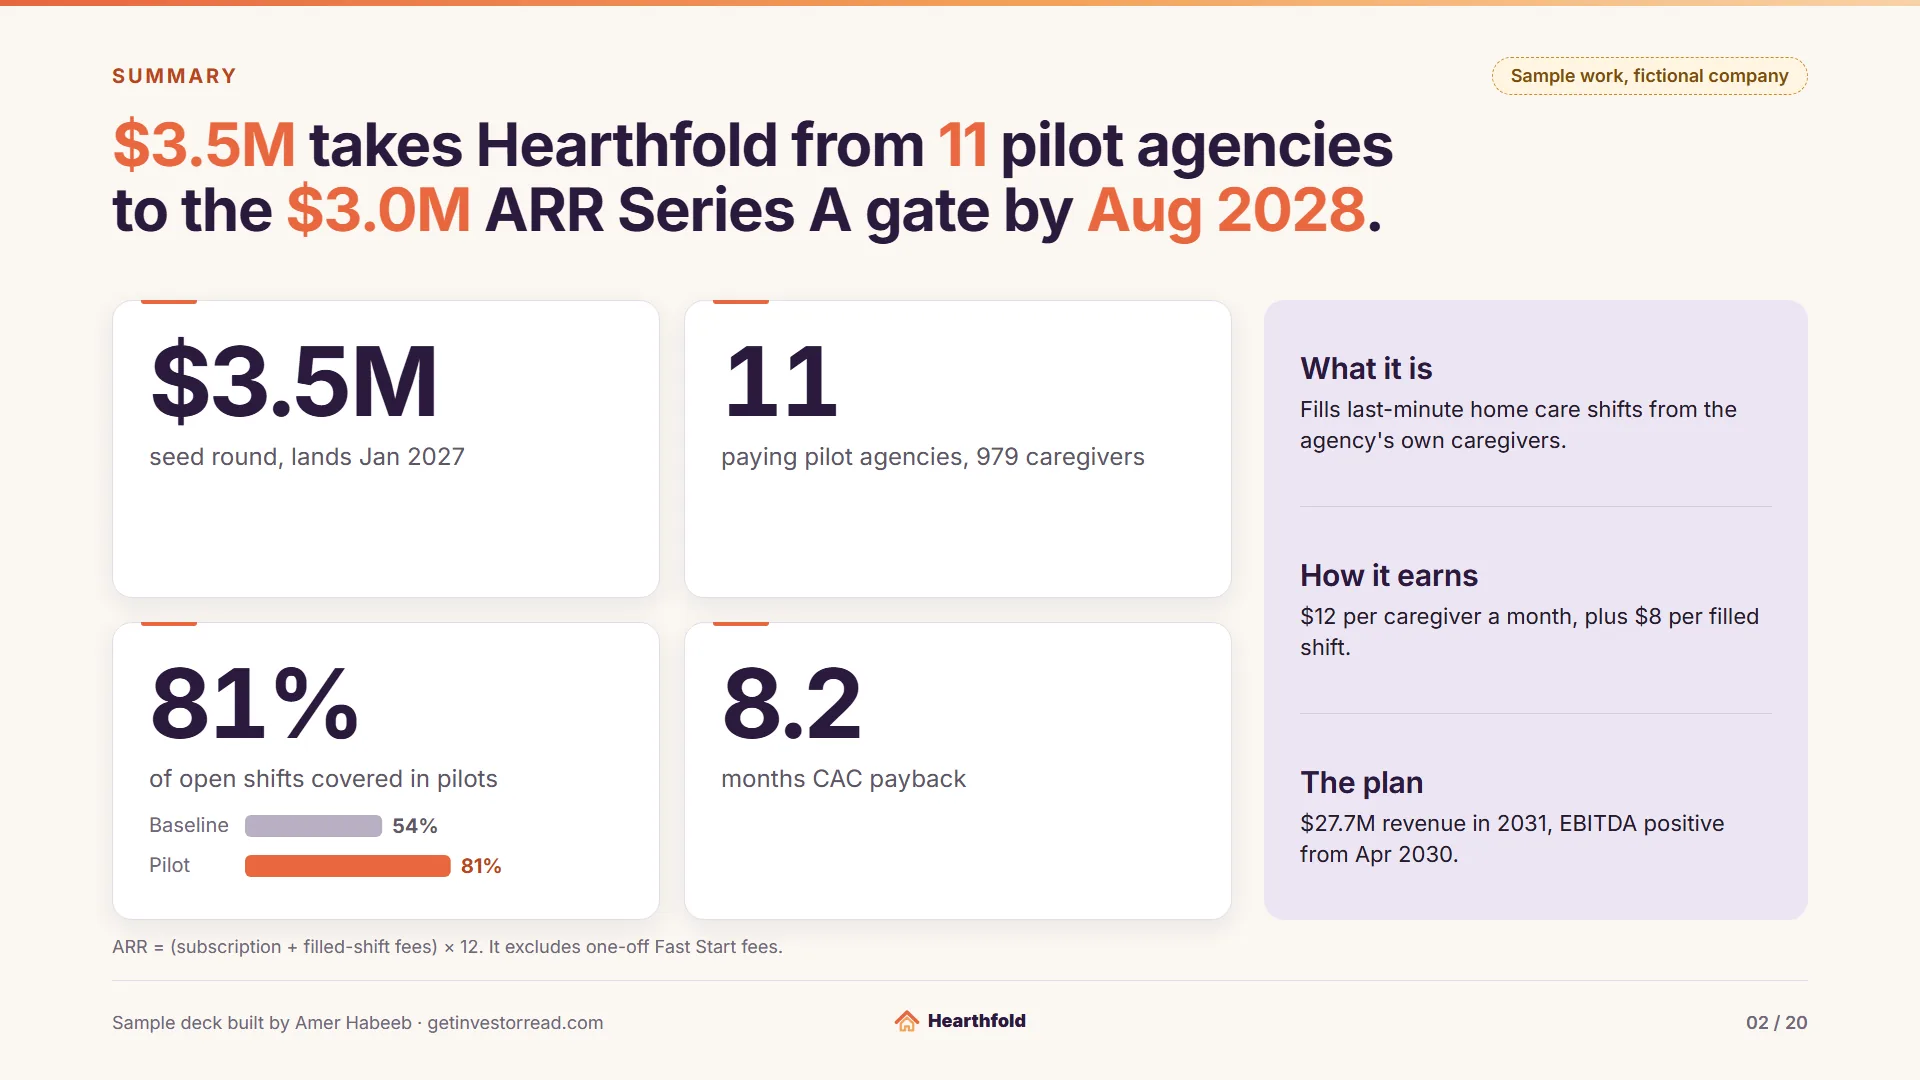
  2. Sample work, fictional company. Summary. Headline: $3.5M takes Hearthfold from 11 pilot agencies to the $3.0M ARR Series A gate by Aug 2028. Four KPI tiles: $3.5M seed round, lands Jan 2027; 11 paying pilot agencies, 979 caregivers; 81% of open shifts covered in pilots, with bars for baseline 54% and pilot 81%; 8.2 months customer acquisition cost payback. Card: What it is: Fills last-minute home care shifts from the agency's own caregivers. How it earns: $12 per caregiver a month, plus $8 per filled shift. The plan: $27.7M revenue in 2031, EBITDA positive from Apr 2030. Footnote: ARR = (subscription + filled-shift fees) × 12. It excludes one-off Fast Start fees. (opens full size in a new tab)
    Slide 2 of 20: SummaryWhy it works. The question here is what the round buys, and the headline answers it in one line: $3.5M, from 11 pilot agencies to $3.0M ARR by Aug 2028. The footnote defines ARR, subscription plus filled-shift revenue, times 12, so it can be rebuilt from the Monthly tab.
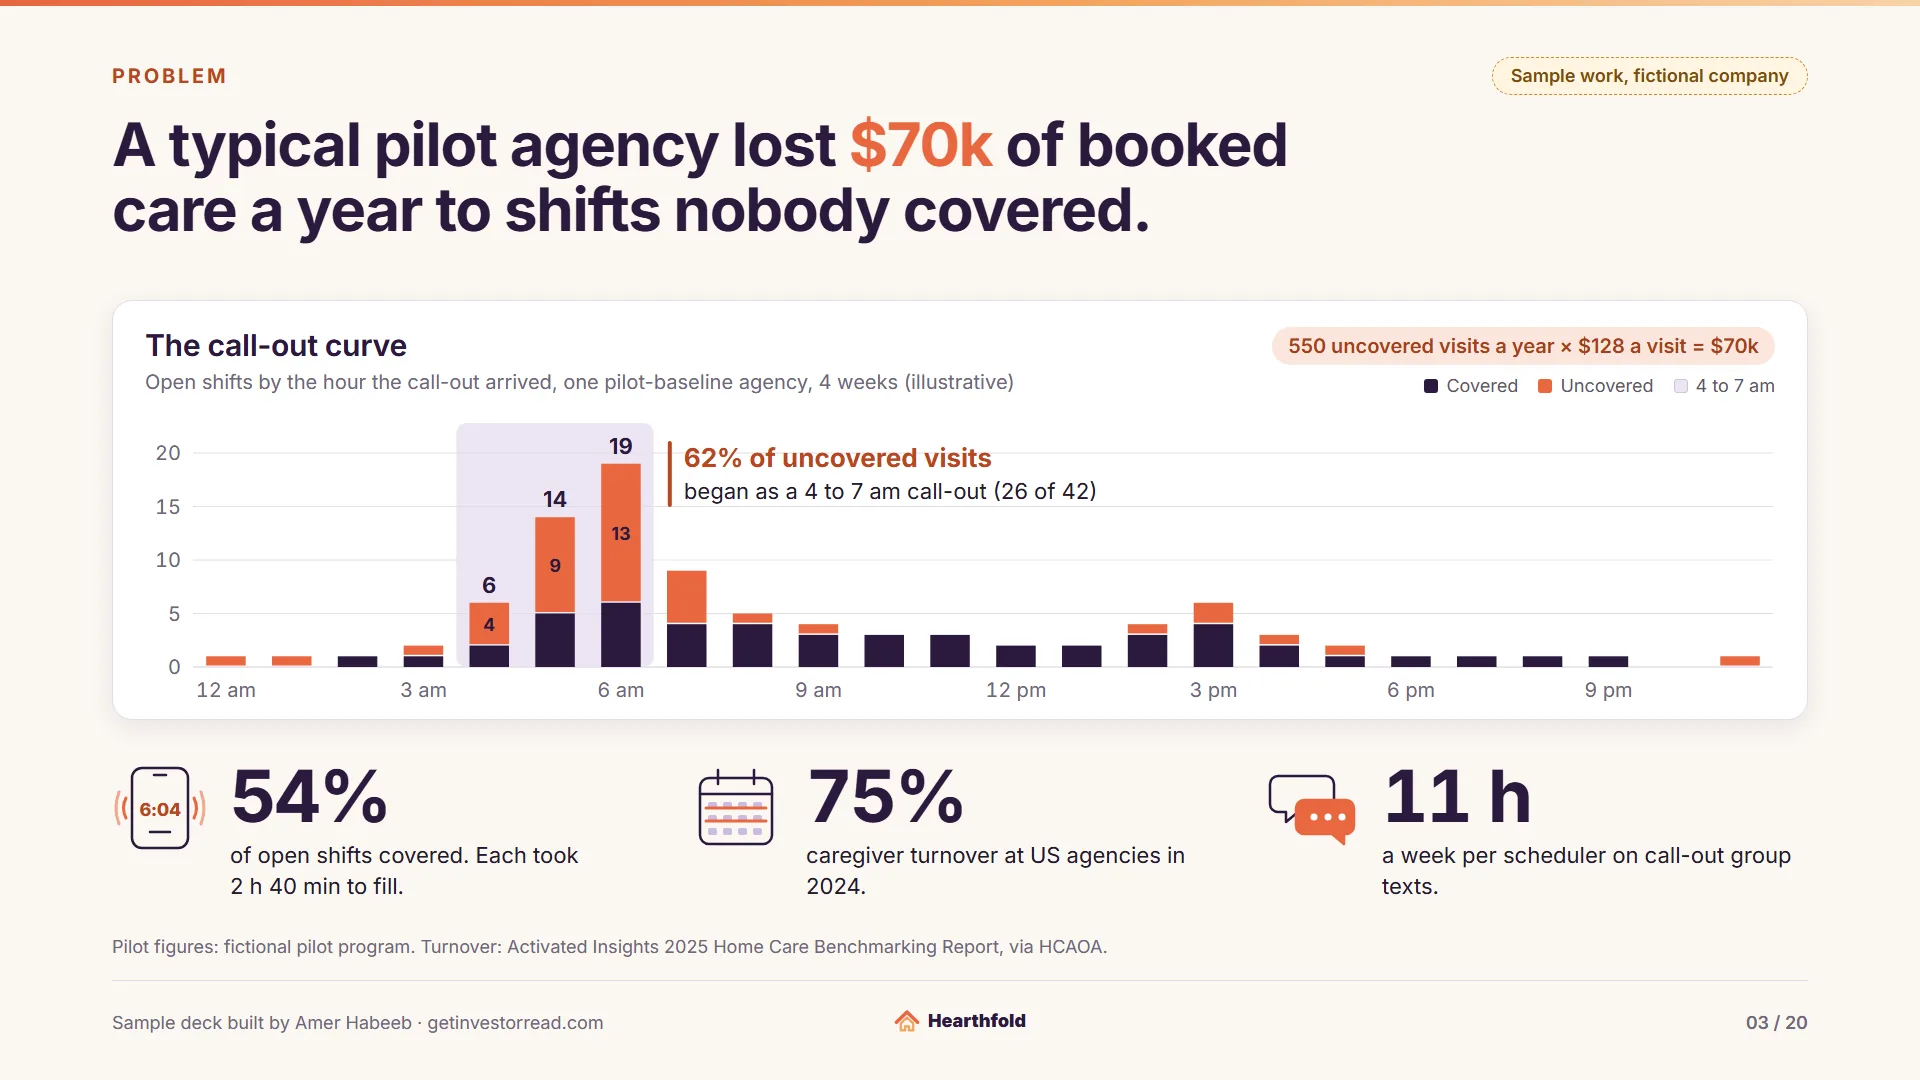
  3. Sample work, fictional company. Problem. Headline: A typical pilot agency lost $70k of booked care a year to shifts nobody covered. Stacked bar chart, the call-out curve: open shifts by the hour the call-out arrived, one pilot-baseline agency, 4 weeks (illustrative), 92 open shifts, 50 covered in aubergine and 42 uncovered in coral. The 4 to 7 am band is shaded: 6 open shifts at 4 am (4 uncovered), 14 open shifts at 5 am (9 uncovered), 19 open shifts at 6 am (13 uncovered), with 26 of the 42 uncovered visits. Annotation: 62% of uncovered visits began as a 4 to 7 am call-out (26 of 42). Chip: 550 uncovered visits a year × $128 a visit = $70k. Legend: Covered, Uncovered, 4 to 7 am. Phone icon showing 6:04. Three figures: 54% of open shifts covered. Each took 2 h 40 min to fill; 75% caregiver turnover at US agencies in 2024; 11 h a week per scheduler on call-out group texts. Source: Pilot figures: fictional pilot program. Turnover: Activated Insights 2025 Home Care Benchmarking Report, via the Home Care Association of America. (opens full size in a new tab)
    Slide 3 of 20: ProblemWhy it works. An investor asks whether the pain has a price. The chip prices it: 550 uncovered visits a year × $128 a visit = $70k. The chart shows where the loss starts, with 26 of 42 uncovered visits in the 4 to 7 am band. The outside figure names its source.
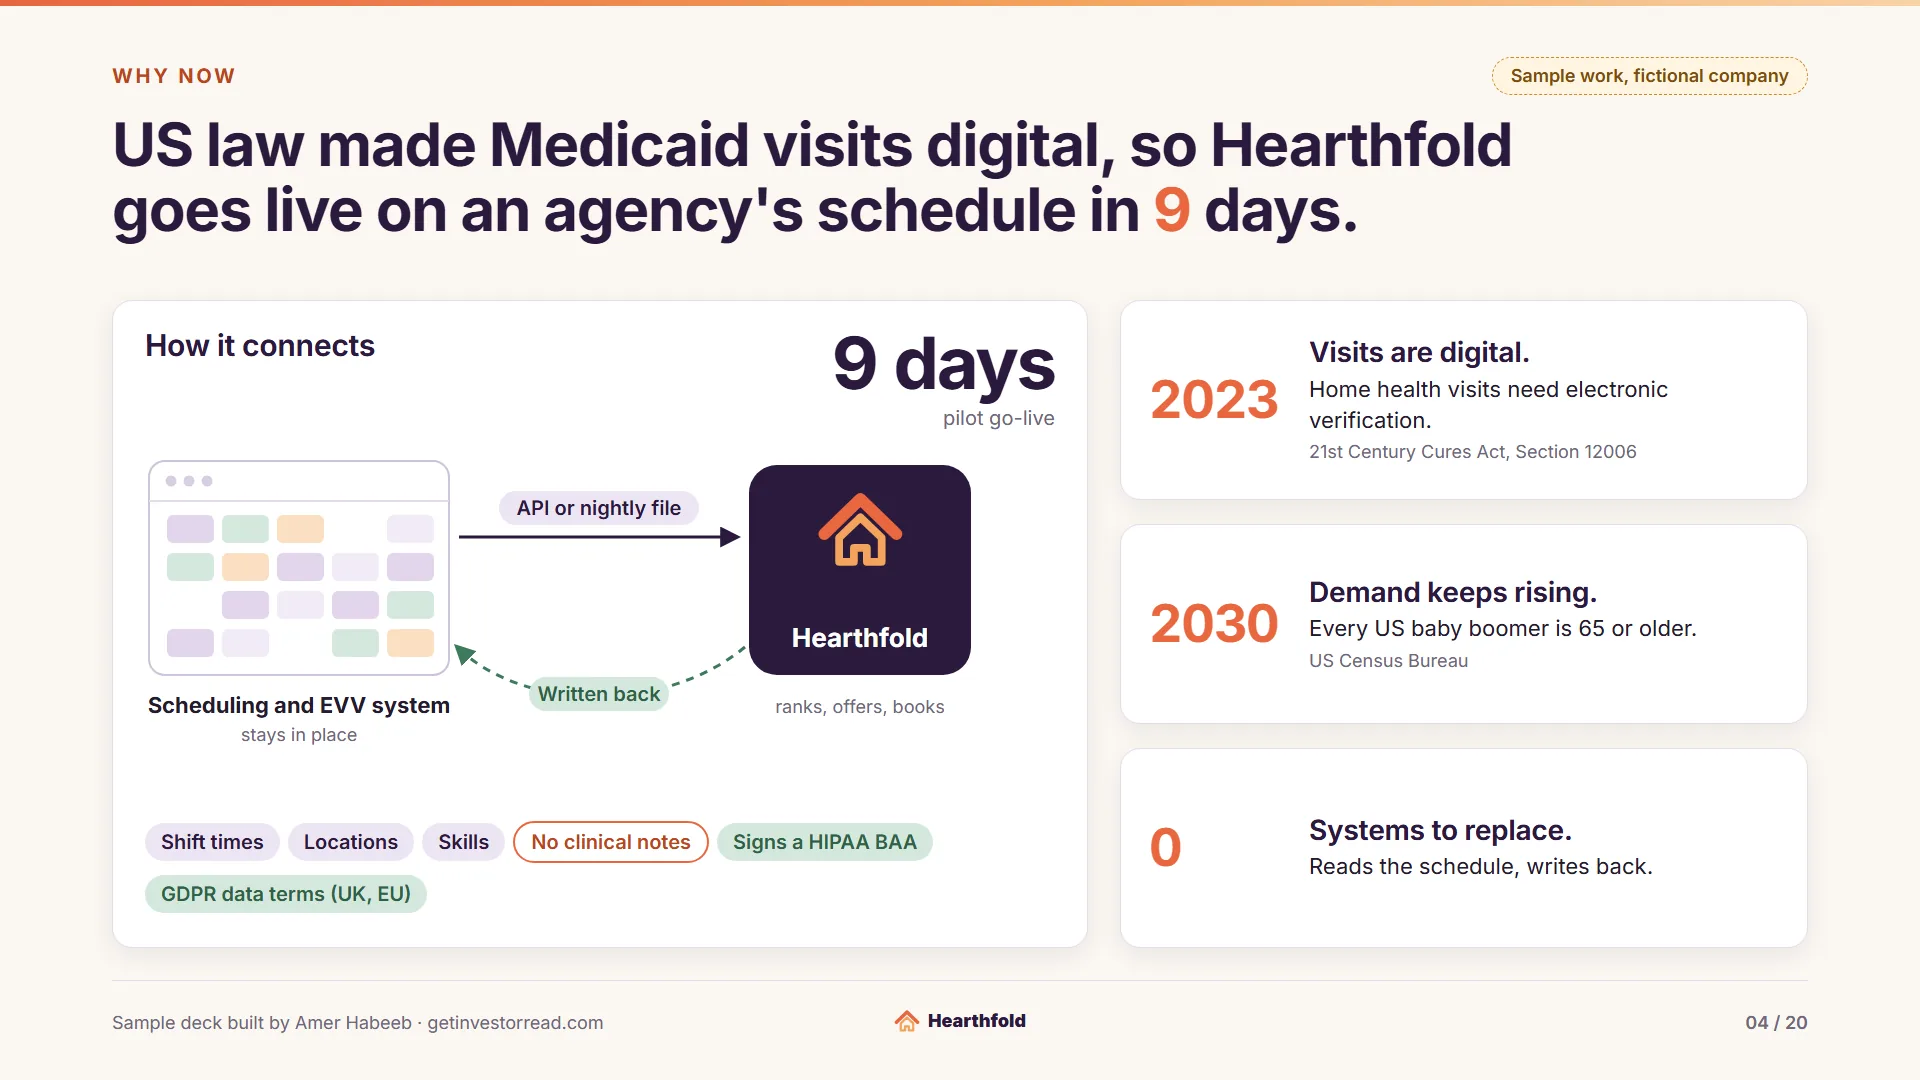
  4. Sample work, fictional company. Why now. Headline: US law made Medicaid visits digital, so Hearthfold goes live on an agency's schedule in 9 days. Card titled How it connects, an integration diagram: a generic scheduling and EVV system, which stays in place, sends data by API or nightly file to Hearthfold (ranks, offers, books), and the result is written back to the schedule. Callout: 9 days pilot go-live. Chips under the diagram: Shift times, Locations, Skills in lilac; No clinical notes, outlined in coral; Signs a HIPAA BAA and GDPR data terms (UK, EU) in sage. Cards: 2023: Visits are digital. Home health visits need electronic verification. Source: 21st Century Cures Act, Section 12006. 2030: Demand keeps rising. Every US baby boomer is 65 or older. Source: US Census Bureau. 0: Systems to replace. Reads the schedule, writes back. (opens full size in a new tab)
    Slide 4 of 20: Why nowWhy it works. Why now, and how hard is it to switch? Visit verification made agency schedules digital, and Hearthfold reads the schedule and writes back, so there are 0 systems to replace. The 9-day go-live is a pilot figure, and both outside facts name their sources.
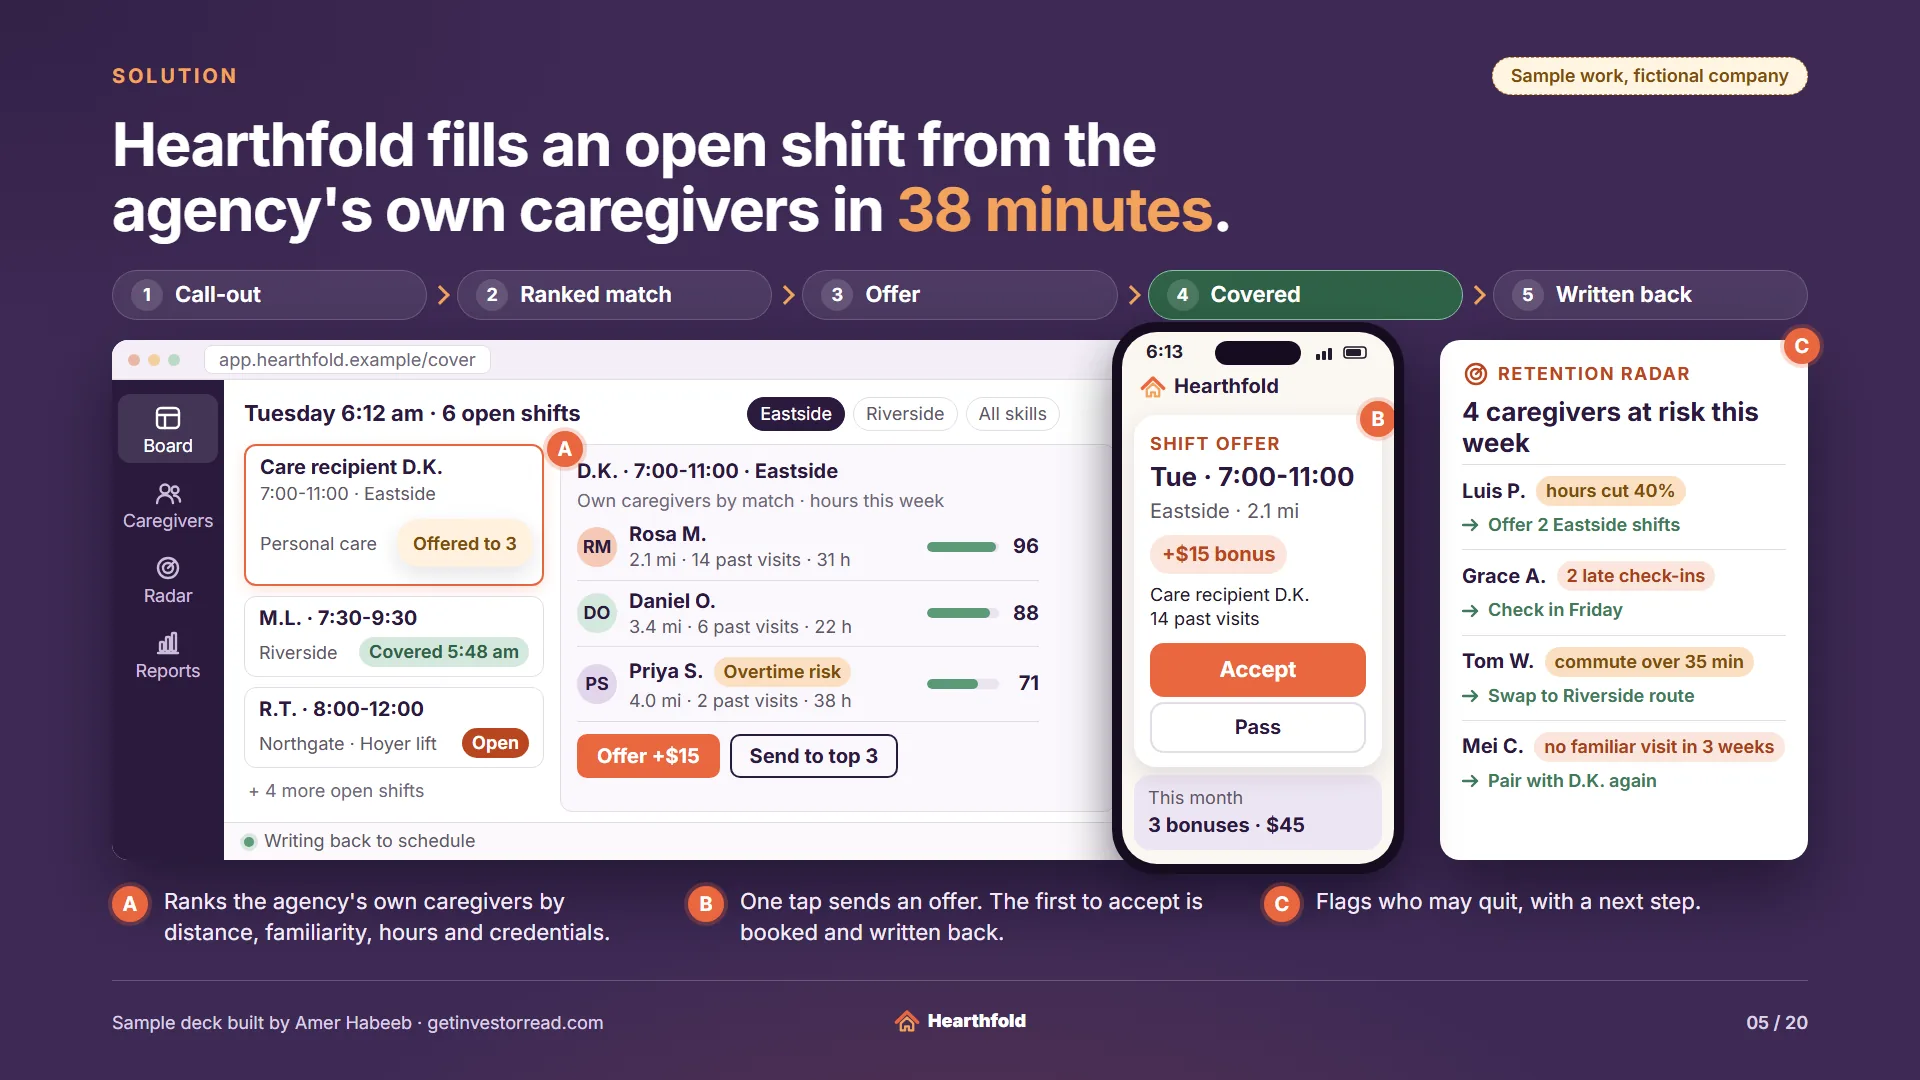
  5. Sample work, fictional company. Solution. Headline: Hearthfold fills an open shift from the agency's own caregivers in 38 minutes. Flow ribbon: call-out, ranked match, offer, covered, written back. Drawn desktop mockup of the Cover Board at app.hearthfold.example/cover, with a side menu of Board, Caregivers, Radar and Reports: Tuesday 6:12 am · 6 open shifts, filters Eastside, Riverside, All skills. Open shifts: Care recipient D.K., 7:00-11:00 · Eastside, Personal care, Offered to 3; M.L. · 7:30-9:30, Riverside, Covered 5:48 am; R.T. · 8:00-12:00, Northgate · Hoyer lift, Open; + 4 more open shifts. Ranked caregivers for D.K. · 7:00-11:00 · Eastside (Own caregivers by match · hours this week): Rosa M. (RM), 2.1 mi · 14 past visits · 31 h, match 96; Daniel O. (DO), 3.4 mi · 6 past visits · 22 h, match 88; Priya S. (PS), 4.0 mi · 2 past visits · 38 h, Overtime risk, match 71. Buttons: Offer +$15 and Send to top 3. Status: writing back to schedule. Phone mockup at 6:13: shift offer, Tue · 7:00-11:00, Eastside · 2.1 mi, +$15 bonus, Care recipient D.K., 14 past visits, Accept and Pass, this month 3 bonuses · 45 dollars. Retention Radar card: 4 caregivers at risk this week: Luis P., hours cut 40%, Offer 2 Eastside shifts; Grace A., 2 late check-ins, Check in Friday; Tom W., commute over 35 min, Swap to Riverside route; Mei C., no familiar visit in 3 weeks, Pair with D.K. again. Captions: Ranks the agency's own caregivers by distance, familiarity, hours and credentials. One tap sends an offer. The first to accept is booked and written back. Flags who may quit, with a next step. (opens full size in a new tab)
    Slide 5 of 20: SolutionWhy it works. An investor wants to see the product do what the headline says. The mockup walks one call-out from open shift to booked: ranked caregivers, an offer with a +$15 bonus, the write-back to the schedule. The 38 minutes is the pilot average the traction slide repeats.
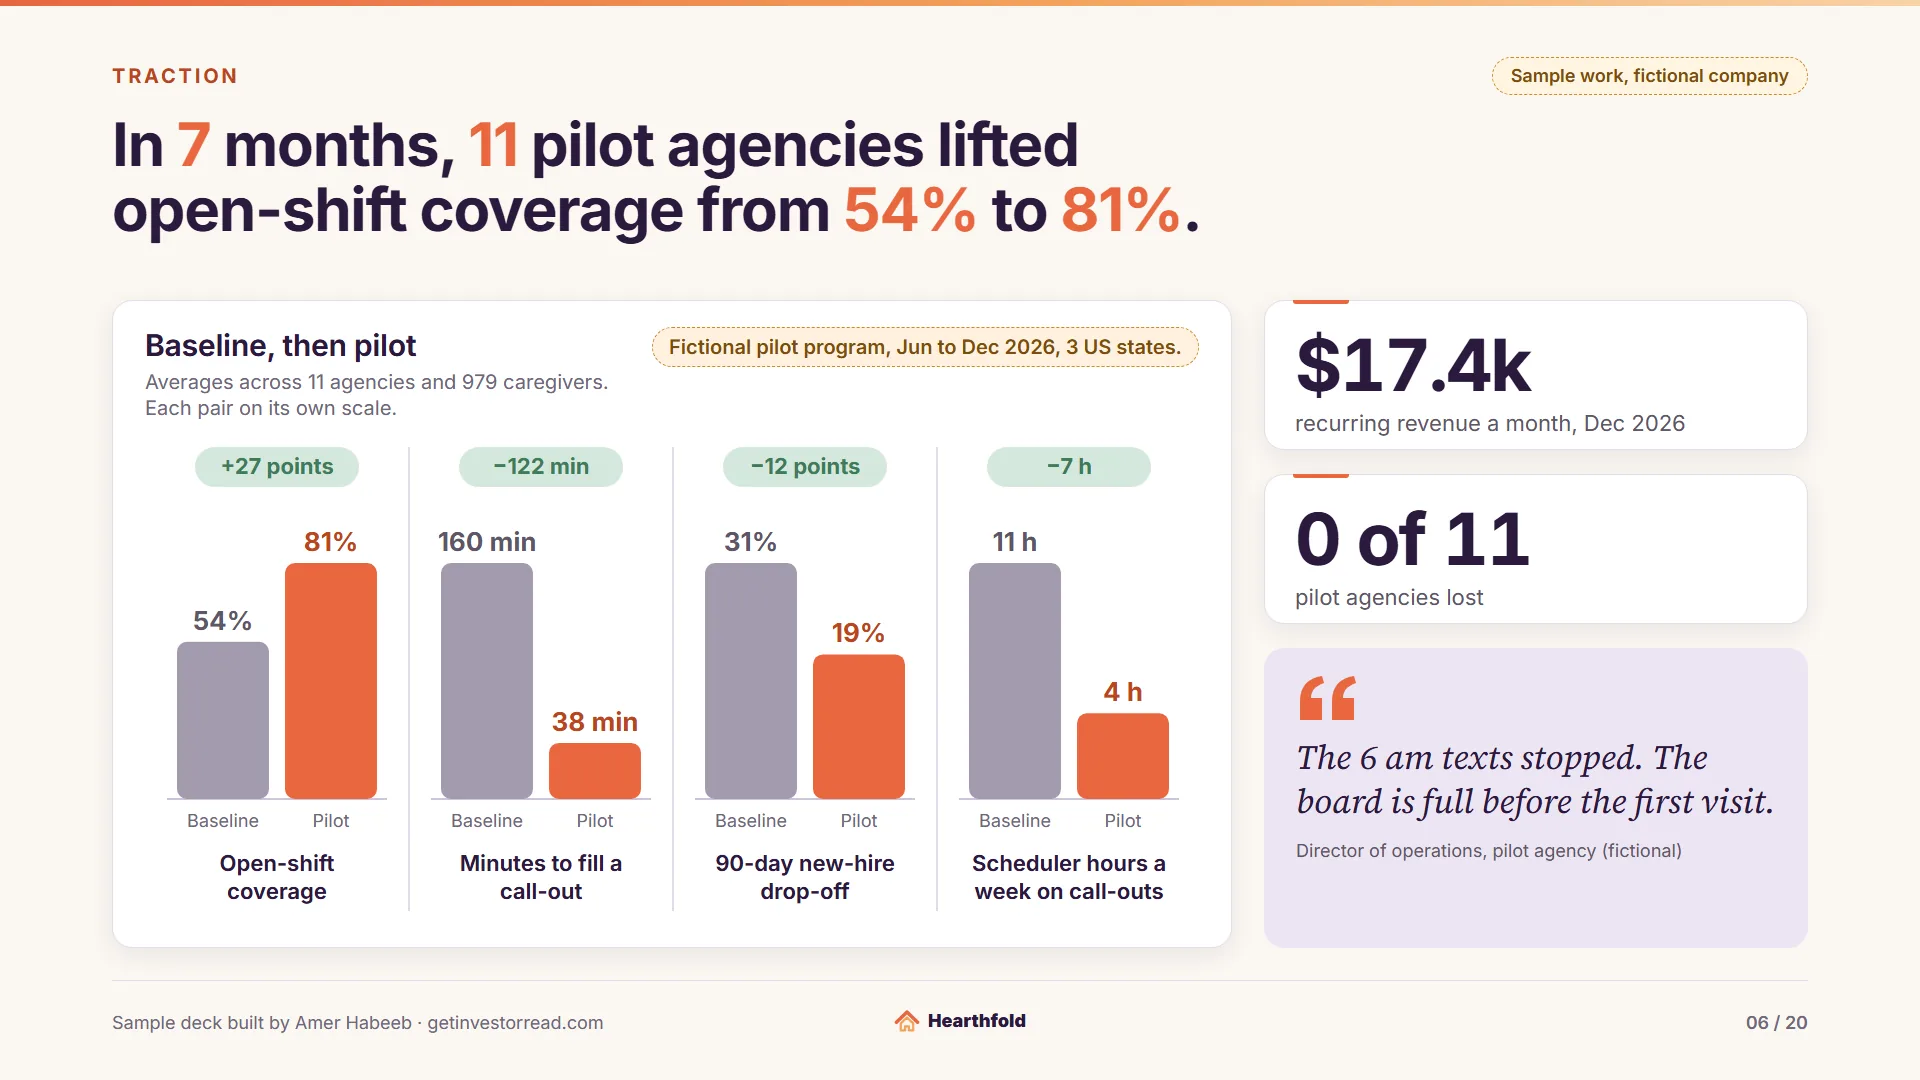
  6. Sample work, fictional company. Traction. Headline: In 7 months, 11 pilot agencies lifted open-shift coverage from 54% to 81%. Label: Fictional pilot program, Jun to Dec 2026, 3 US states. Card: Baseline, then pilot. Averages across 11 agencies and 979 caregivers. Each pair on its own scale. Four small bar charts, baseline in slate and pilot in coral: Open-shift coverage 54% then 81%, +27 points; Minutes to fill a call-out 160 min then 38 min, minus 122 min; 90-day new-hire drop-off 31% then 19%, minus 12 points; Scheduler hours a week on call-outs 11 h then 4 h, minus 7 h. Tiles: $17.4k recurring revenue a month, Dec 2026; 0 of 11 pilot agencies lost. Pull quote: The 6 am texts stopped. The board is full before the first visit. Director of operations, pilot agency (fictional). (opens full size in a new tab)
    Slide 6 of 20: TractionWhy it works. Each pilot result is a baseline bar beside a pilot bar, each pair on its own scale: coverage from 54% to 81%, fill time from 160 to 38 minutes, scheduler time from 11 h to 4 h. The pilot program, its dates and the quote are labeled fictional.
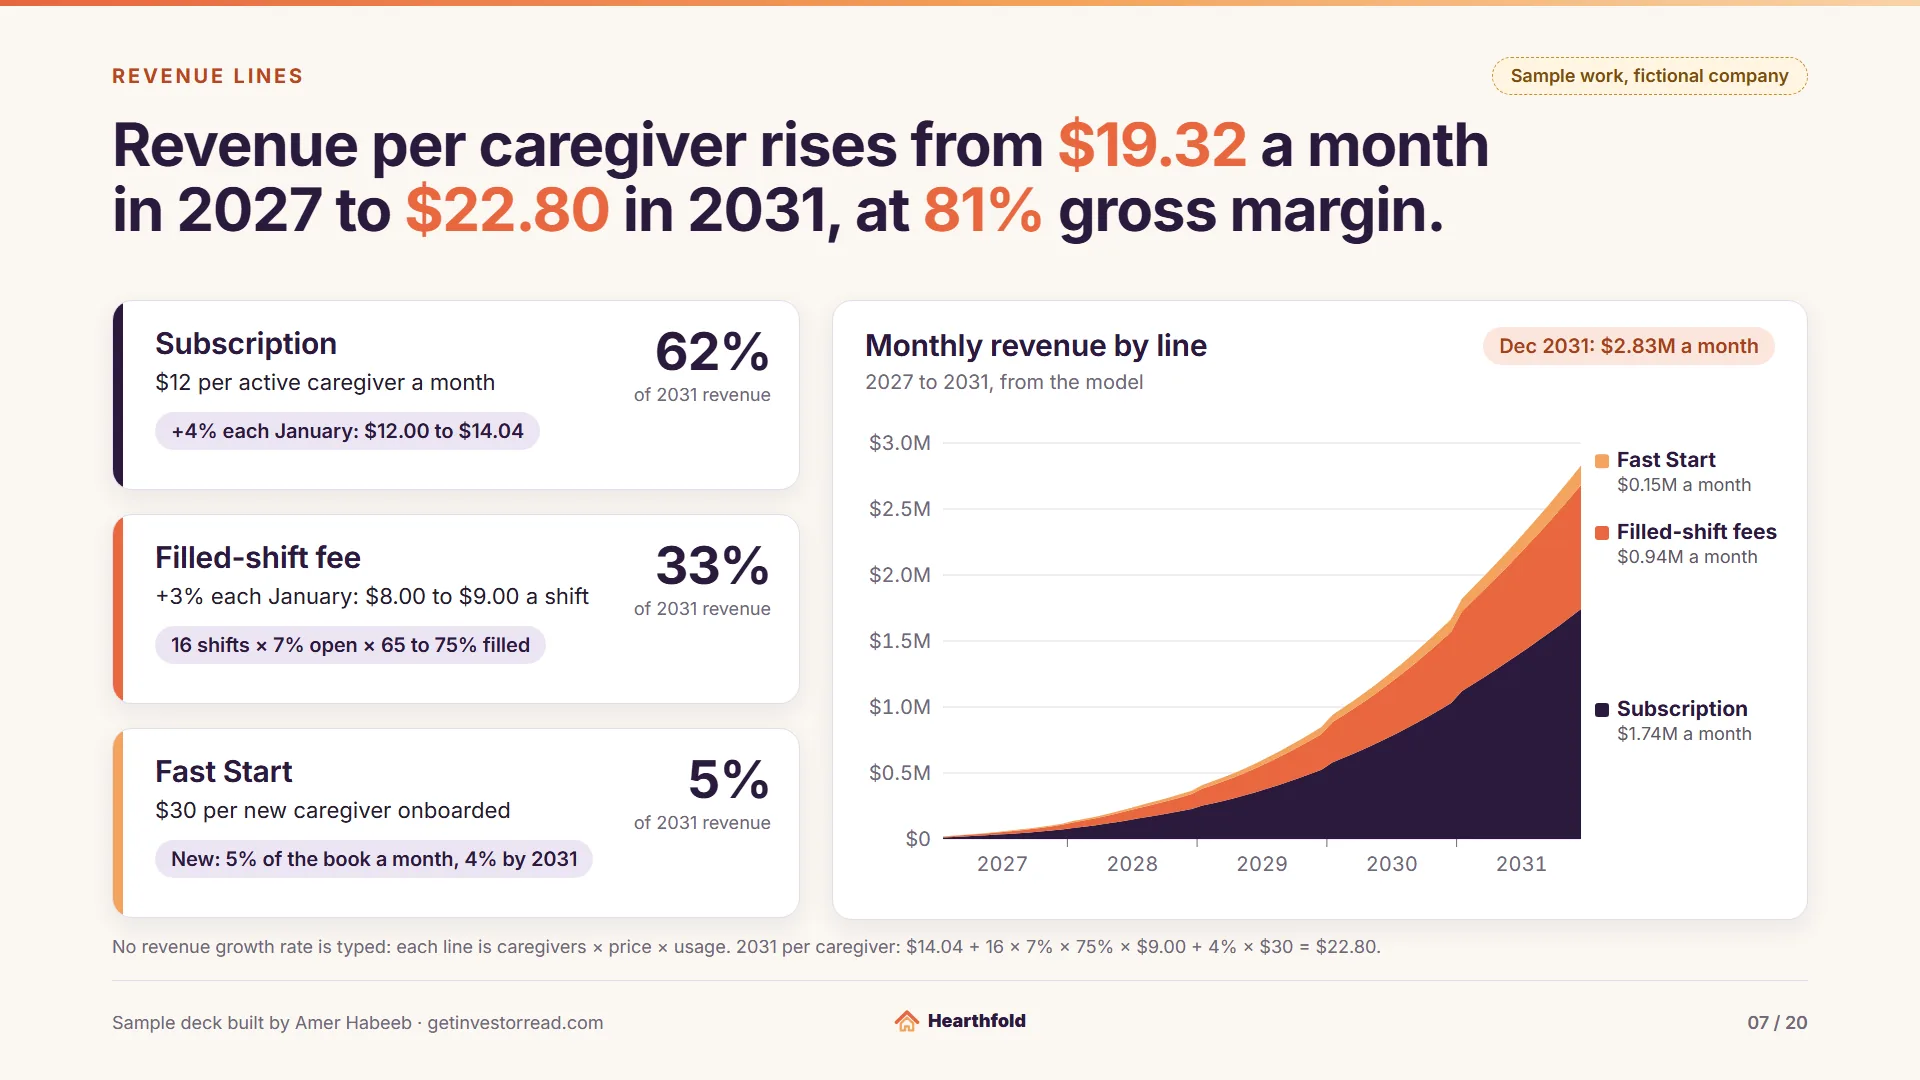
  7. Sample work, fictional company. Revenue lines. Headline: Revenue per caregiver rises from $19.32 a month in 2027 to $22.80 in 2031, at 81% gross margin. Three cards, each with its share of 2031 revenue, its price and its driver chip: Subscription, 62% of 2031 revenue, $12 per active caregiver a month, chip +4% each January: $12.00 to $14.04; Filled-shift fee, 33% of 2031 revenue, +3% each January: $8.00 to $9.00 a shift, chip 16 shifts × 7% open × 65 to 75% filled; Fast Start, 5% of 2031 revenue, $30 per new caregiver onboarded, chip New: 5% of the book a month, 4% by 2031. Card: Monthly revenue by line, 2027 to 2031, from the model. Stacked area chart of monthly revenue from Jan 2027 to Dec 2031: subscription in aubergine, filled-shift fees in coral, Fast Start in apricot. Labels at the right edge: Subscription $1.74M a month; Filled-shift fees $0.94M a month; Fast Start $0.15M a month. December values: subscription $72k, $227k, $525k, $1029k, $1742k; fees $35k, $113k, $269k, $541k, $939k; Fast Start $9k, $26k, $55k, $97k, $149k. Chip: Dec 2031: $2.83M a month. Footnote: No revenue growth rate is typed: each line is caregivers × price × usage. 2031 per caregiver: $14.04 + 16 × 7% × 75% × $9.00 + 4% × $30 = $22.80. (opens full size in a new tab)
    Slide 7 of 20: Revenue linesWhy it works. The investor question is whether revenue is built or typed. The footnote answers it: each line is caregivers × price × usage, and 2031 revenue per caregiver works out to $22.80. The prices and their January rises are inputs on the Assumptions tab.
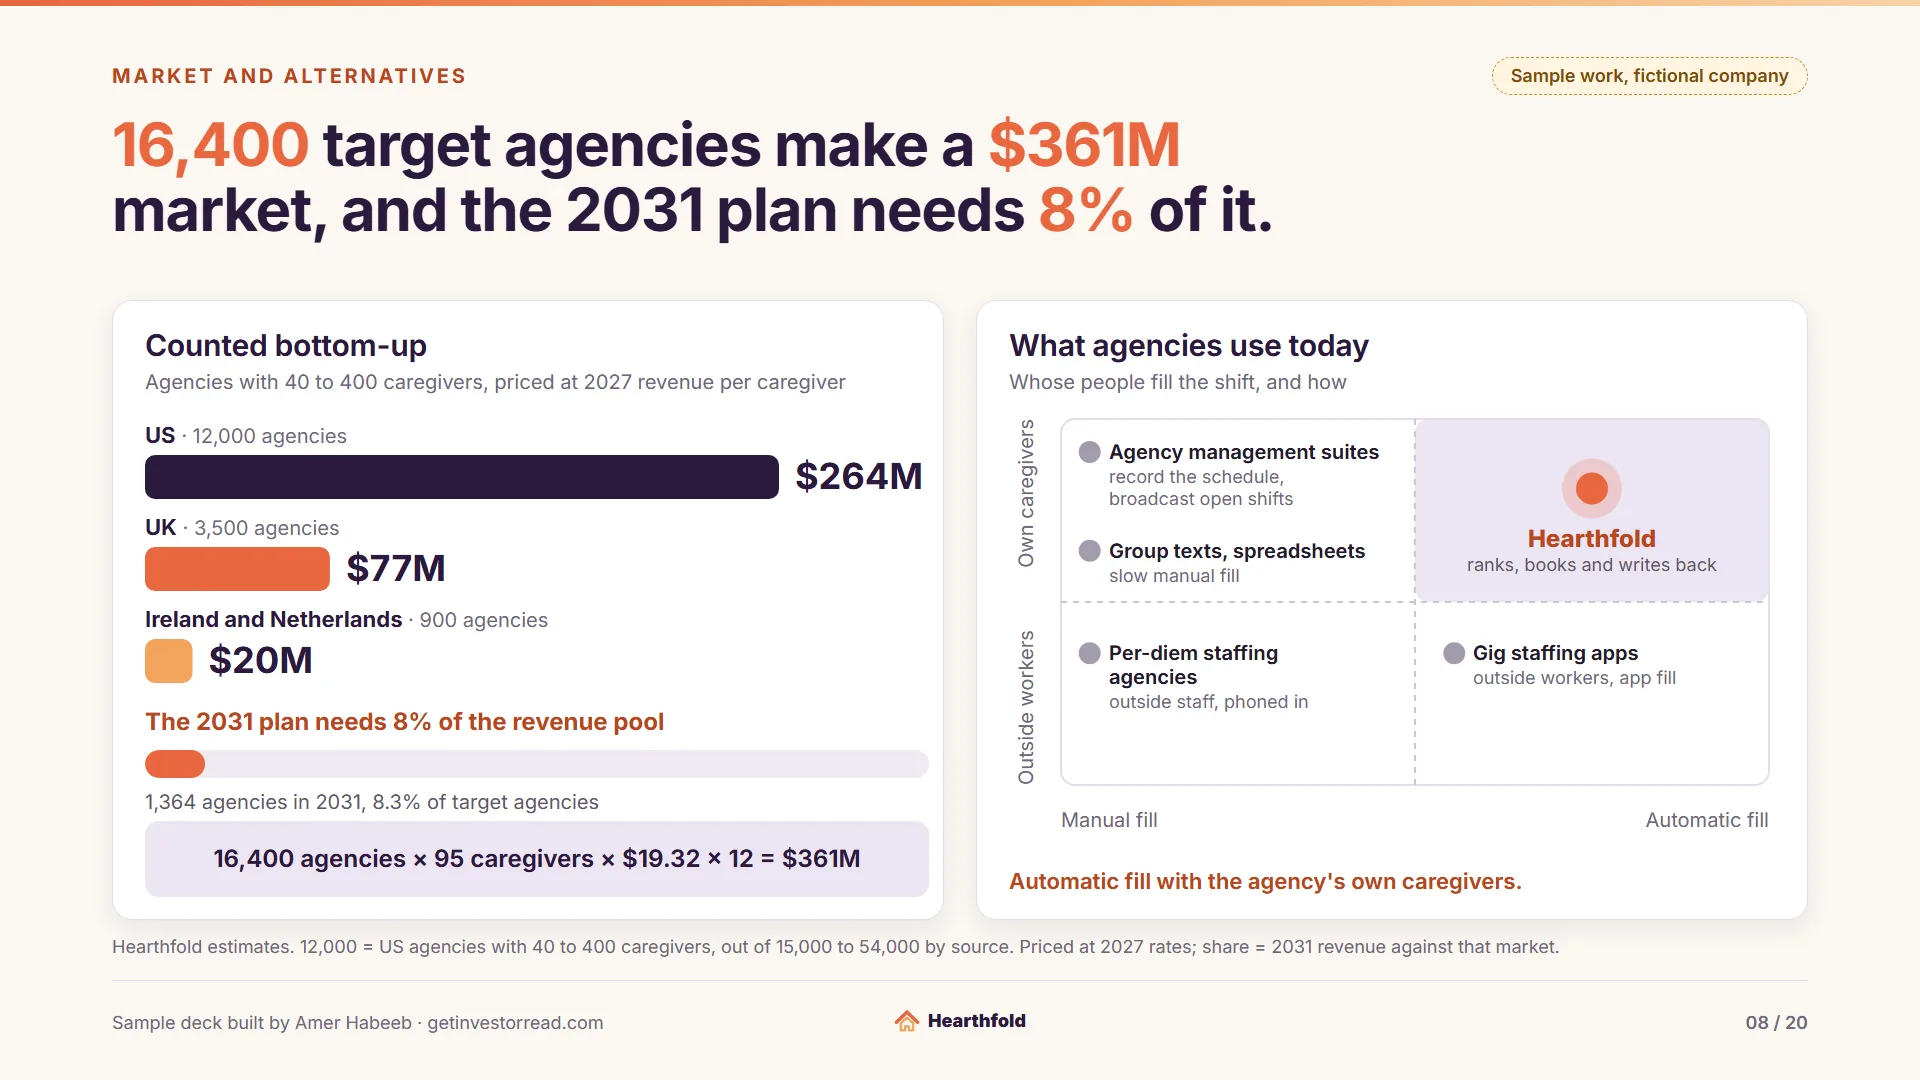
  8. Sample work, fictional company. Market and alternatives. Headline: 16,400 target agencies make a $361M market, and the 2031 plan needs 8% of it. Bars of the serviceable market, counted bottom-up from agencies with 40 to 400 caregivers, priced at 2027 revenue per caregiver: US 12,000 agencies, $264M; UK 3,500 agencies, $77M; Ireland and Netherlands 900 agencies, $20M. Strip: the 2031 plan needs 8% of the revenue pool; 1,364 agencies in 2031, 8.3% of target agencies. Formula: 16,400 agencies × 95 caregivers × $19.32 × 12 = $361M. Alternatives, a quadrant chart titled What agencies use today, whose people fill the shift, and how: x axis from manual fill to automatic fill, y axis from outside workers to own caregivers, the own caregivers and automatic fill quadrant shaded. Agency management suites: own caregivers, manual fill; record the schedule, broadcast open shifts. Group texts, spreadsheets: own caregivers, manual fill; slow manual fill. Per-diem staffing agencies: outside workers, manual fill; outside staff, phoned in. Gig staffing apps: outside workers, automatic fill; outside workers, app fill. Hearthfold: own caregivers, automatic fill, alone in its quadrant; ranks, books and writes back. Line: Automatic fill with the agency's own caregivers. Source: Hearthfold estimates. 12,000 = US agencies with 40 to 400 caregivers, out of 15,000 to 54,000 by source. Priced at 2027 rates; share = 2031 revenue against that market. (opens full size in a new tab)
    Slide 8 of 20: Market and alternativesWhy it works. The market is counted, not quoted: 16,400 agencies × 95 caregivers × $19.32 × 12 = $361M. The share can be checked too, since the 2031 plan needs 8% of that pool. The quadrant shows what agencies use today and where Hearthfold sits.
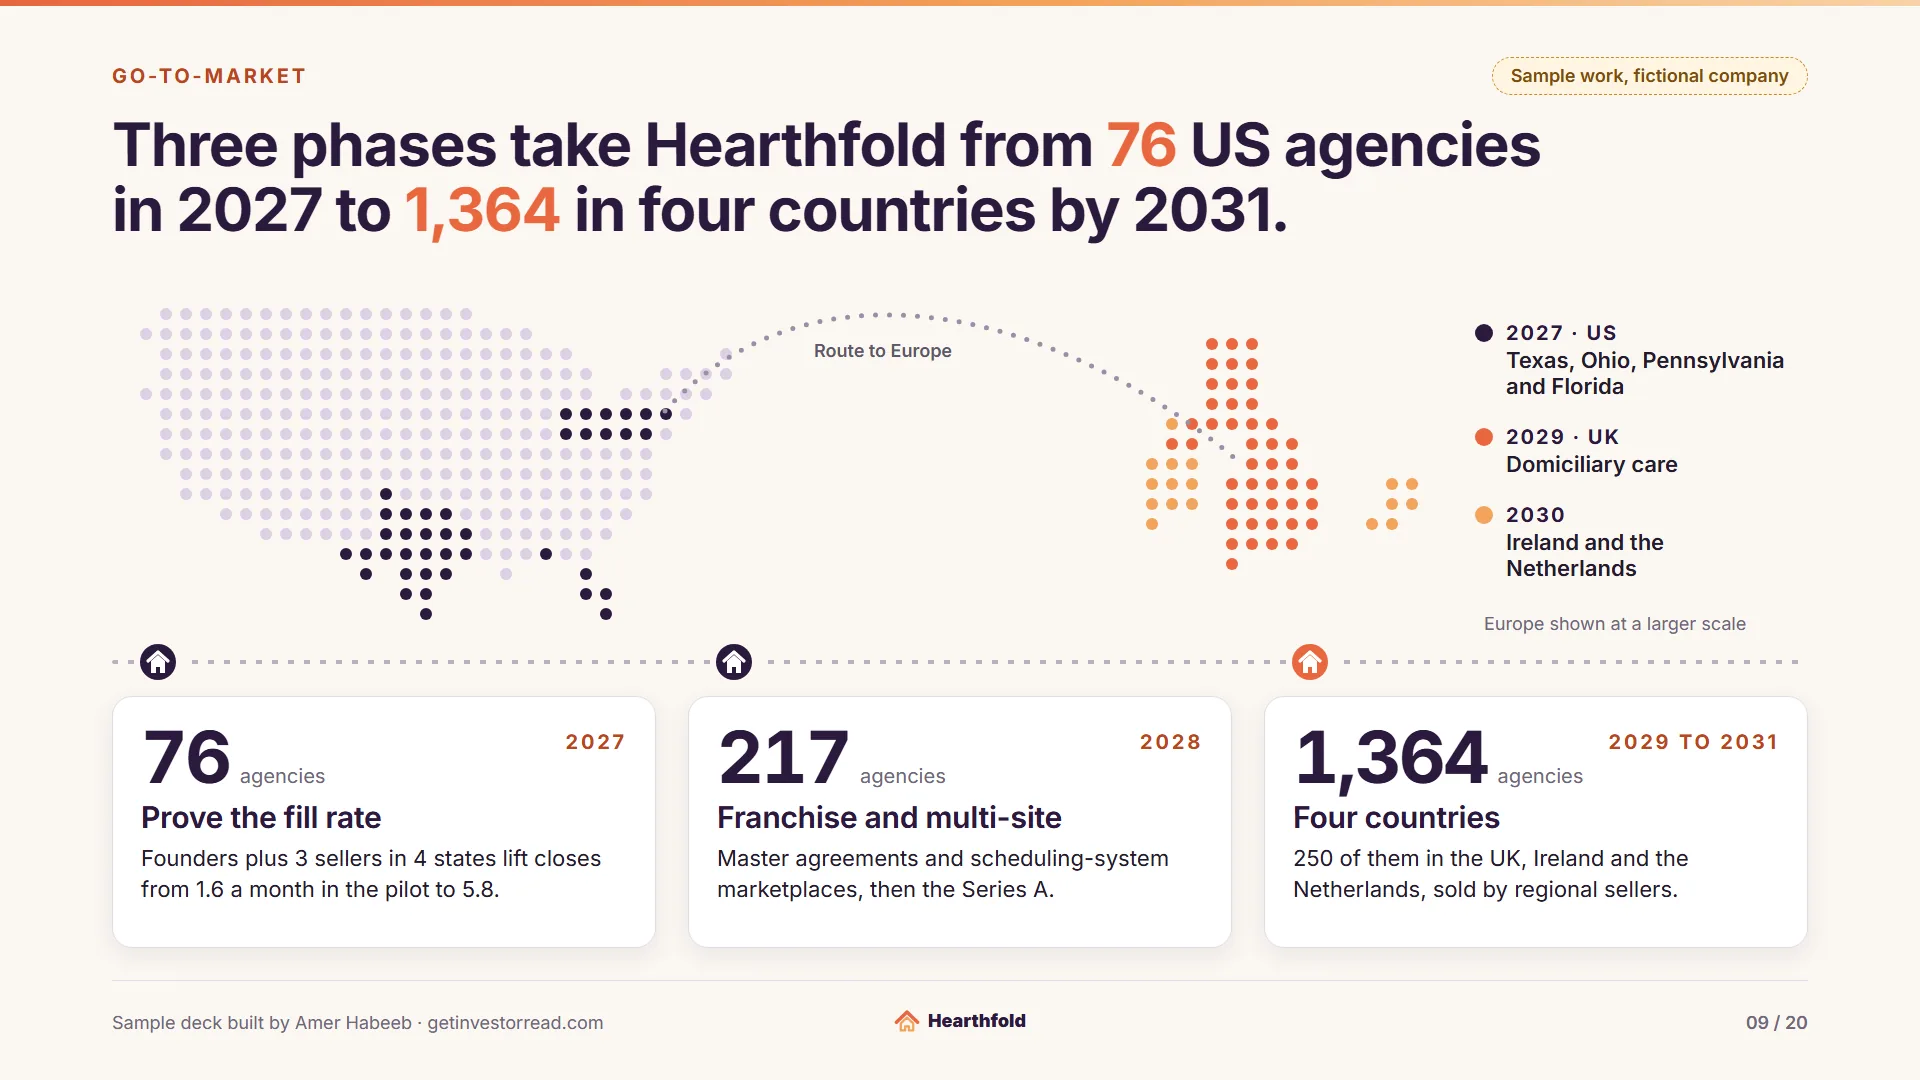
  9. Sample work, fictional company. Go-to-market. Headline: Three phases take Hearthfold from 76 US agencies in 2027 to 1,364 in four countries by 2031. Abstract dot map: the US in light dots with Texas, Ohio, Pennsylvania and Florida in aubergine for 2027; a dotted gray line labeled Route to Europe crosses the Atlantic to a larger-scale inset of the UK in coral for 2029 and Ireland and the Netherlands in apricot for 2030. Legend: 2027 · US: Texas, Ohio, Pennsylvania and Florida; 2029 · UK: Domiciliary care; 2030: Ireland and the Netherlands. Europe shown at a larger scale. Three phase cards on a track: 2027, prove the fill rate, Founders plus 3 sellers in 4 states lift closes from 1.6 a month in the pilot to 5.8. 76 agencies. 2028, franchise and multi-site, Master agreements and scheduling-system marketplaces, then the Series A. 217 agencies. 2029 to 2031, four countries, 1,364 agencies in total, 250 of them in the UK, Ireland and the Netherlands, sold by regional sellers. The UK launches in Jan 2029, Ireland and the Netherlands in Jan 2030. (opens full size in a new tab)
    Slide 9 of 20: Go-to-marketWhy it works. An investor checks that the sales plan and the customer count agree. Each phase card carries its agency total, 76 in 2027, 217 in 2028 and 1,364 by 2031, the year-end counts on the Monthly tab. Closes rise from 1.6 a month in the pilot to 5.8.
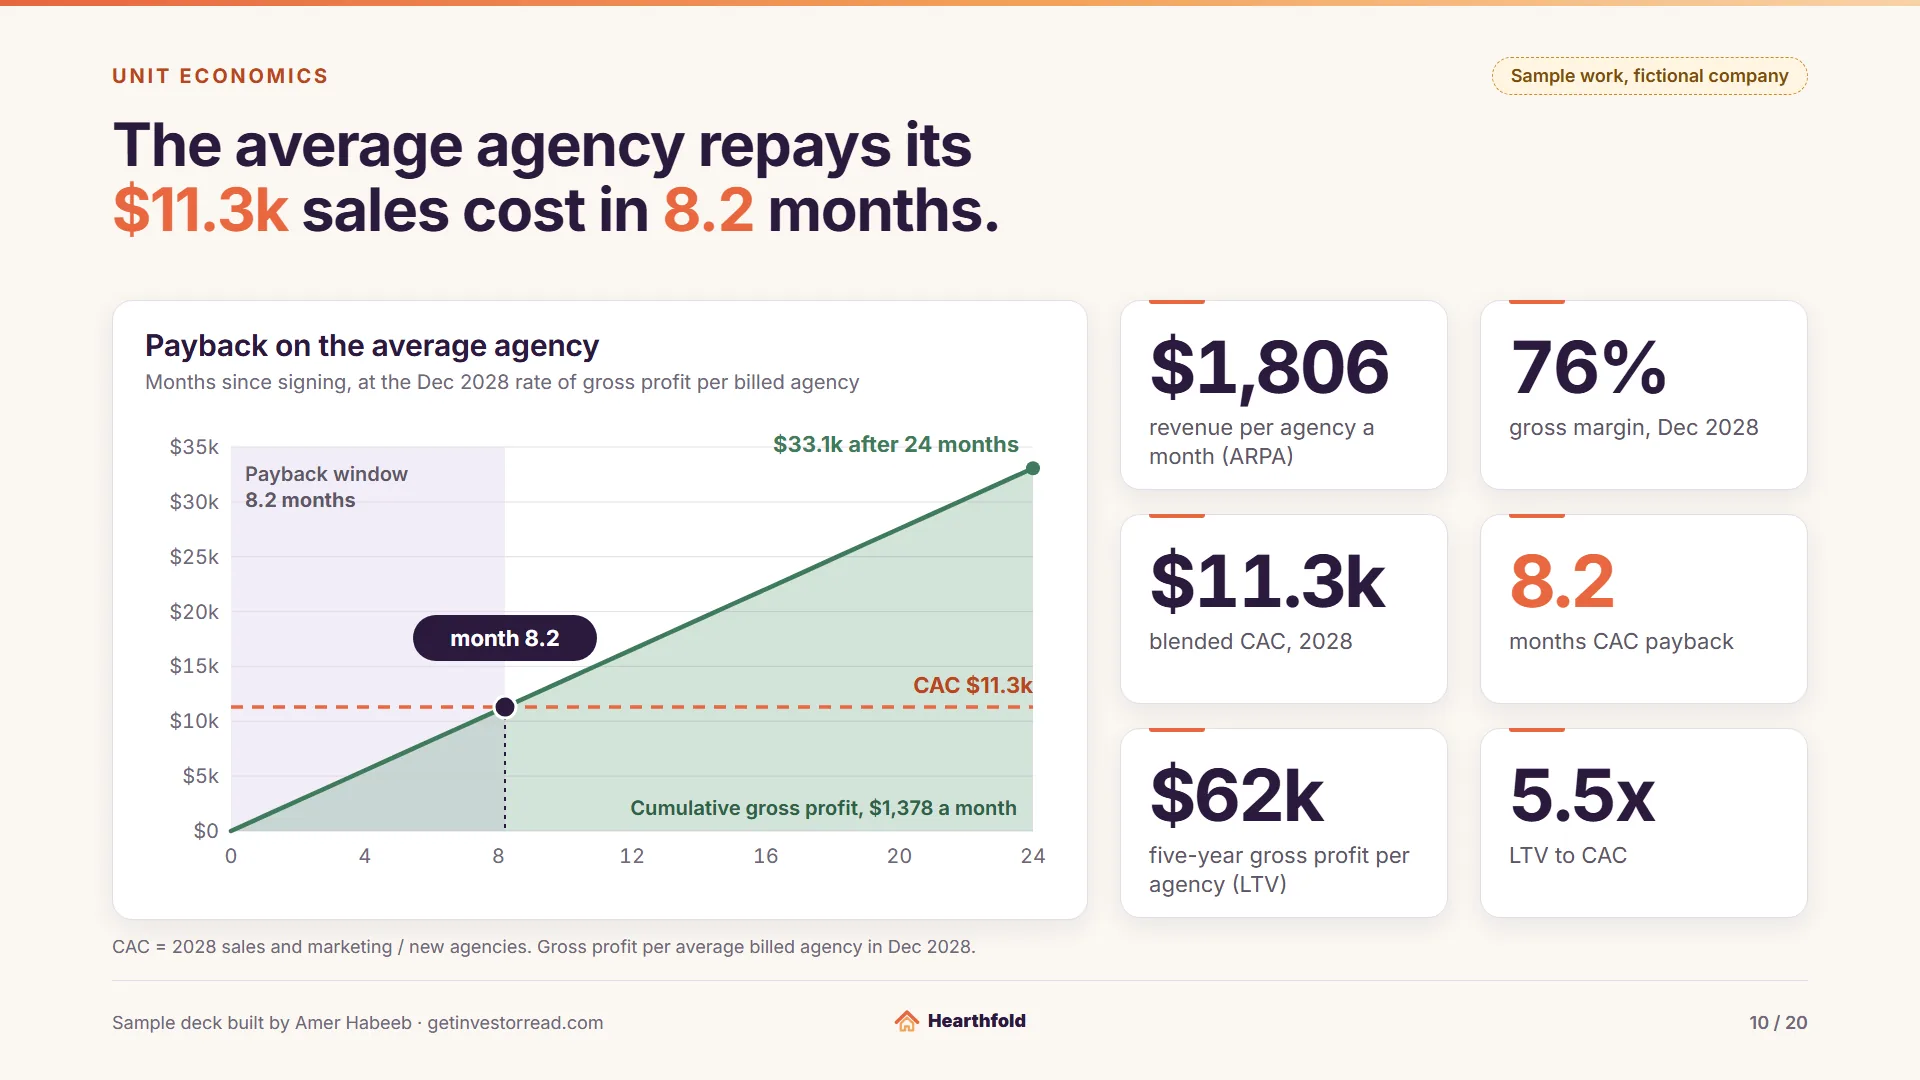
  10. Sample work, fictional company. Unit economics. Headline: The average agency repays its $11.3k sales cost in 8.2 months. Card: Payback on the average agency, Months since signing, at the Dec 2028 rate of gross profit per billed agency. Line chart over months 0 to 24 since signing, a sage area labeled Cumulative gross profit, $1,378 a month: cumulative gross profit per agency rises by $1,378 a month to $33.1k after 24 months; a coral dashed line at customer acquisition cost $11.3k; the lines cross at month 8.2, the payback window. Tiles: $1,806 revenue per agency a month (ARPA); 76% gross margin, Dec 2028; $11.3k blended customer acquisition cost, 2028; 8.2 months customer acquisition cost payback; $62k five-year gross profit per agency (LTV); 5.5x LTV to customer acquisition cost. Footnote: customer acquisition cost = 2028 sales and marketing / new agencies. Gross profit per average billed agency in Dec 2028. (opens full size in a new tab)
    Slide 10 of 20: Unit economicsWhy it works. Payback is drawn, not just stated: $1,378 of gross profit a month per agency crosses the $11.3k sales cost at month 8.2. The footnote gives the cost formula, 2028 sales and marketing over new agencies, so it can be redone from the Unit Economics tab.
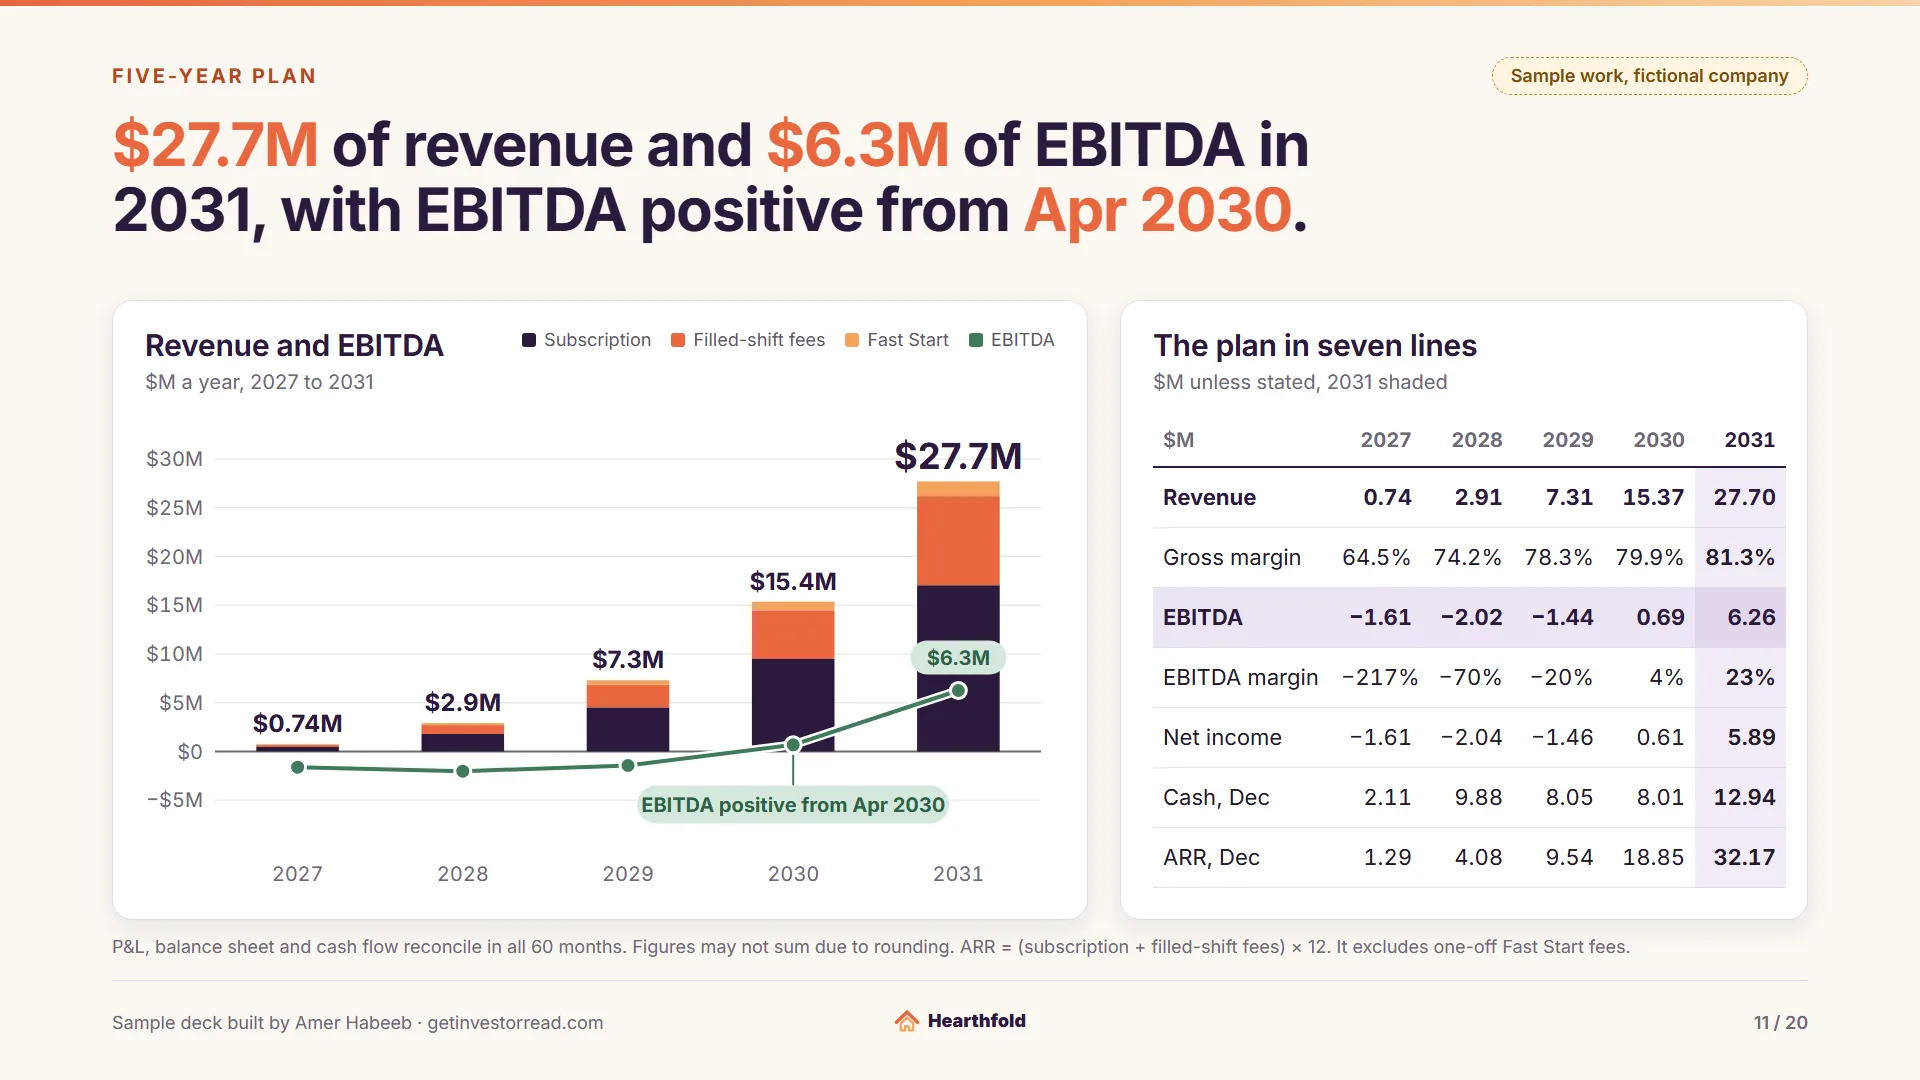
  11. Sample work, fictional company. Five-year plan, 2027 to 2031. Headline: $27.7M of revenue and $6.3M of EBITDA in 2031, with EBITDA positive from Apr 2030. Card: Revenue and EBITDA, $M a year, 2027 to 2031. Stacked bar chart of revenue by line in $M a year (subscription, filled-shift fees, Fast Start), totals $0.74M, $2.9M, $7.3M, $15.4M, $27.7M, with an EBITDA line on the same axis: minus $1.6M, minus $2.0M, minus $1.4M, $0.69M, $6.3M, crossing zero with EBITDA positive from Apr 2030. Card: The plan in seven lines, $M unless stated, 2031 shaded. Table, $M, columns 2027, 2028, 2029, 2030, 2031: Revenue: 0.74, 2.91, 7.31, 15.37, 27.70. Gross margin: 64.5%, 74.2%, 78.3%, 79.9%, 81.3%. EBITDA: minus 1.61, minus 2.02, minus 1.44, 0.69, 6.26. EBITDA margin: minus 217%, minus 70%, minus 20%, 4%, 23%. Net income: minus 1.61, minus 2.04, minus 1.46, 0.61, 5.89. Cash, Dec: 2.11, 9.88, 8.05, 8.01, 12.94. ARR, Dec: 1.29, 4.08, 9.54, 18.85, 32.17. Footnote: P&L, balance sheet and cash flow reconcile in all 60 months. Figures may not sum due to rounding. ARR = (subscription + filled-shift fees) × 12. It excludes one-off Fast Start fees. (opens full size in a new tab)
    Slide 11 of 20: Five-year planWhy it works. The table puts margin, EBITDA, net income, cash and ARR side by side, so an investor can trace 2031 from $27.7M of revenue to $6.3M of EBITDA. The footnote says the three statements reconcile in all 60 months; the Checks tab is where that is tested.
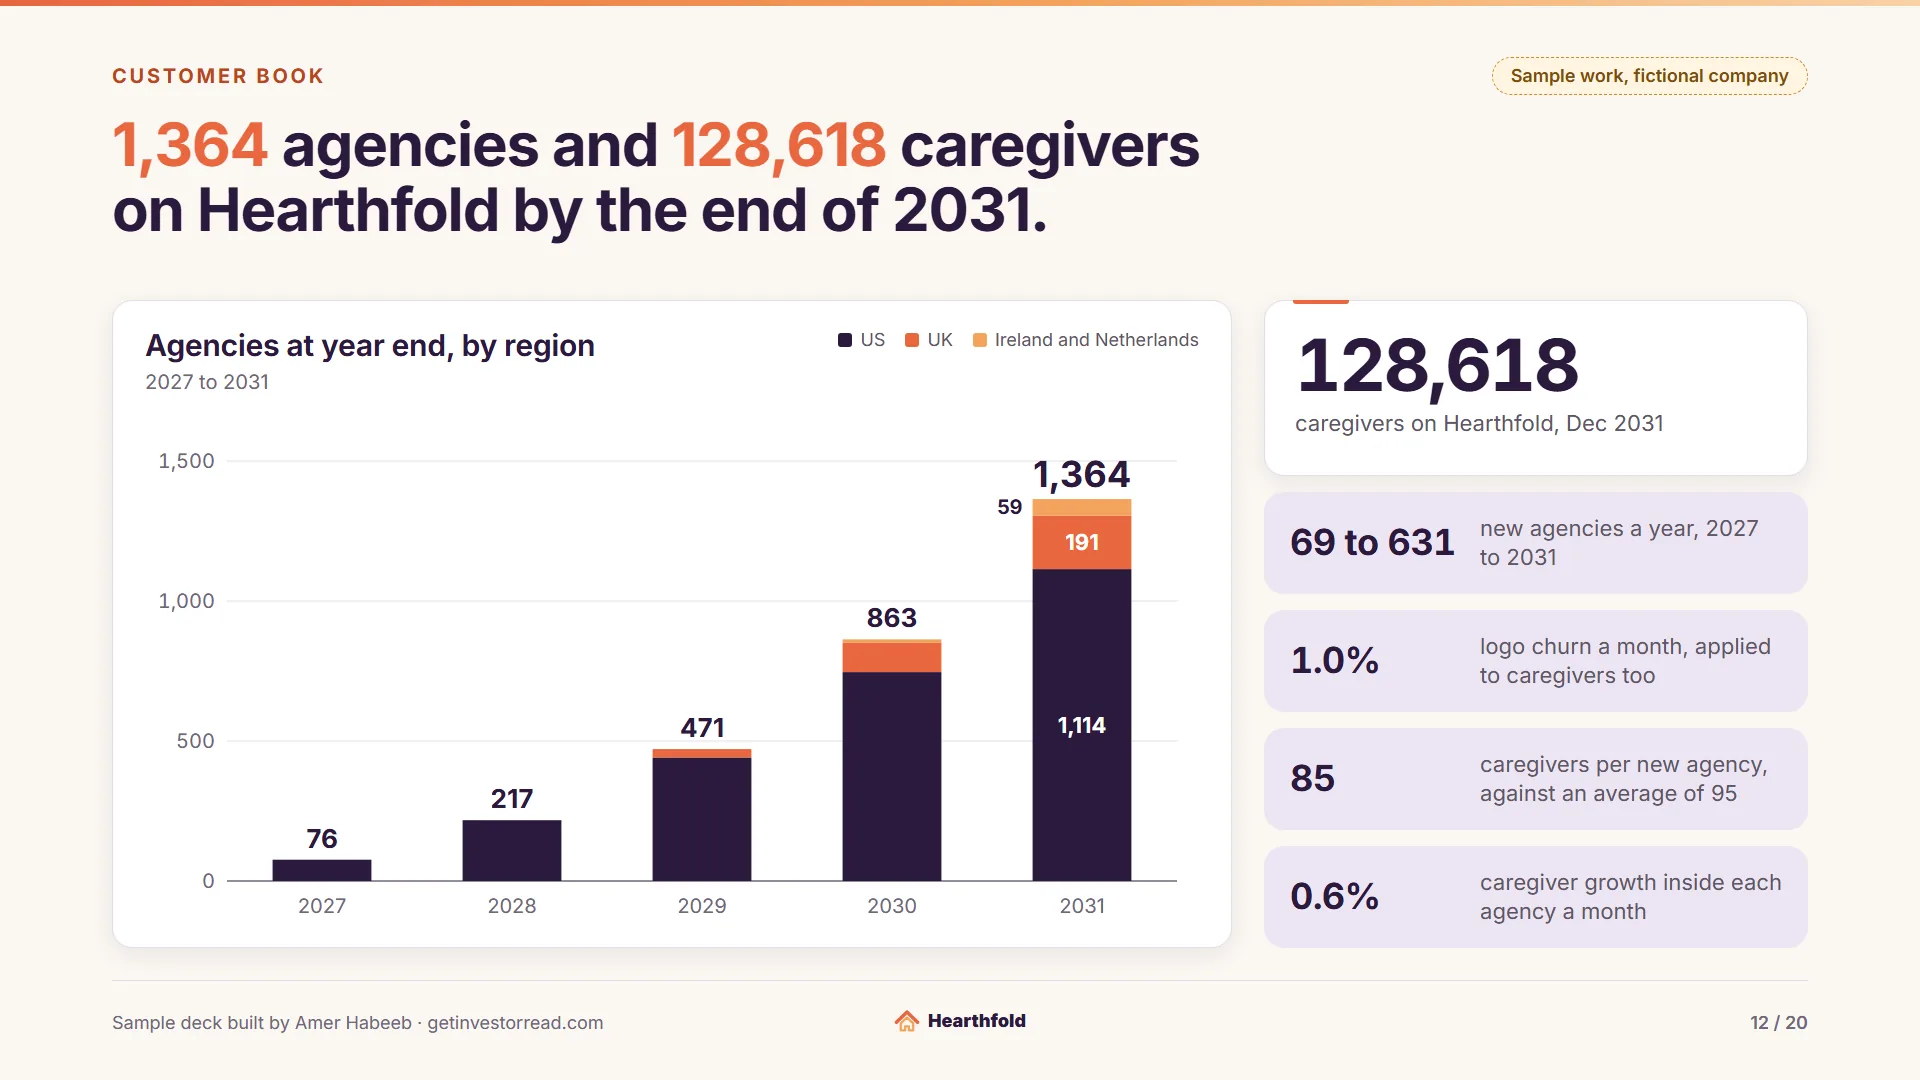
  12. Sample work, fictional company. Customer book. Headline: 1,364 agencies and 128,618 caregivers on Hearthfold by the end of 2031. Card: Agencies at year end, by region, 2027 to 2031. Stacked bars, US aubergine, UK coral, Ireland and Netherlands apricot: 2027: 76 total (US 76, UK 0, Ireland and Netherlands 0); 2028: 217 total (US 217, UK 0, Ireland and Netherlands 0); 2029: 471 total (US 441, UK 30, Ireland and Netherlands 0); 2030: 863 total (US 746, UK 105, Ireland and Netherlands 12); 2031: 1,364 total (US 1,114, UK 191, Ireland and Netherlands 59). Tile: 128,618 caregivers on Hearthfold, Dec 2031. Drivers: 69 to 631 new agencies a year, 2027 to 2031; 1.0% logo churn a month, applied to caregivers too; 85 caregivers per new agency, against an average of 95; 0.6% caregiver growth inside each agency a month. (opens full size in a new tab)
    Slide 12 of 20: Customer bookWhy it works. The investor checks what drives the count. The drivers sit under the bars: 1.0% logo churn a month, 85 caregivers per new agency and 0.6% growth inside each agency, which build to 1,364 agencies and 128,618 caregivers. Each driver is an input on the Assumptions tab.
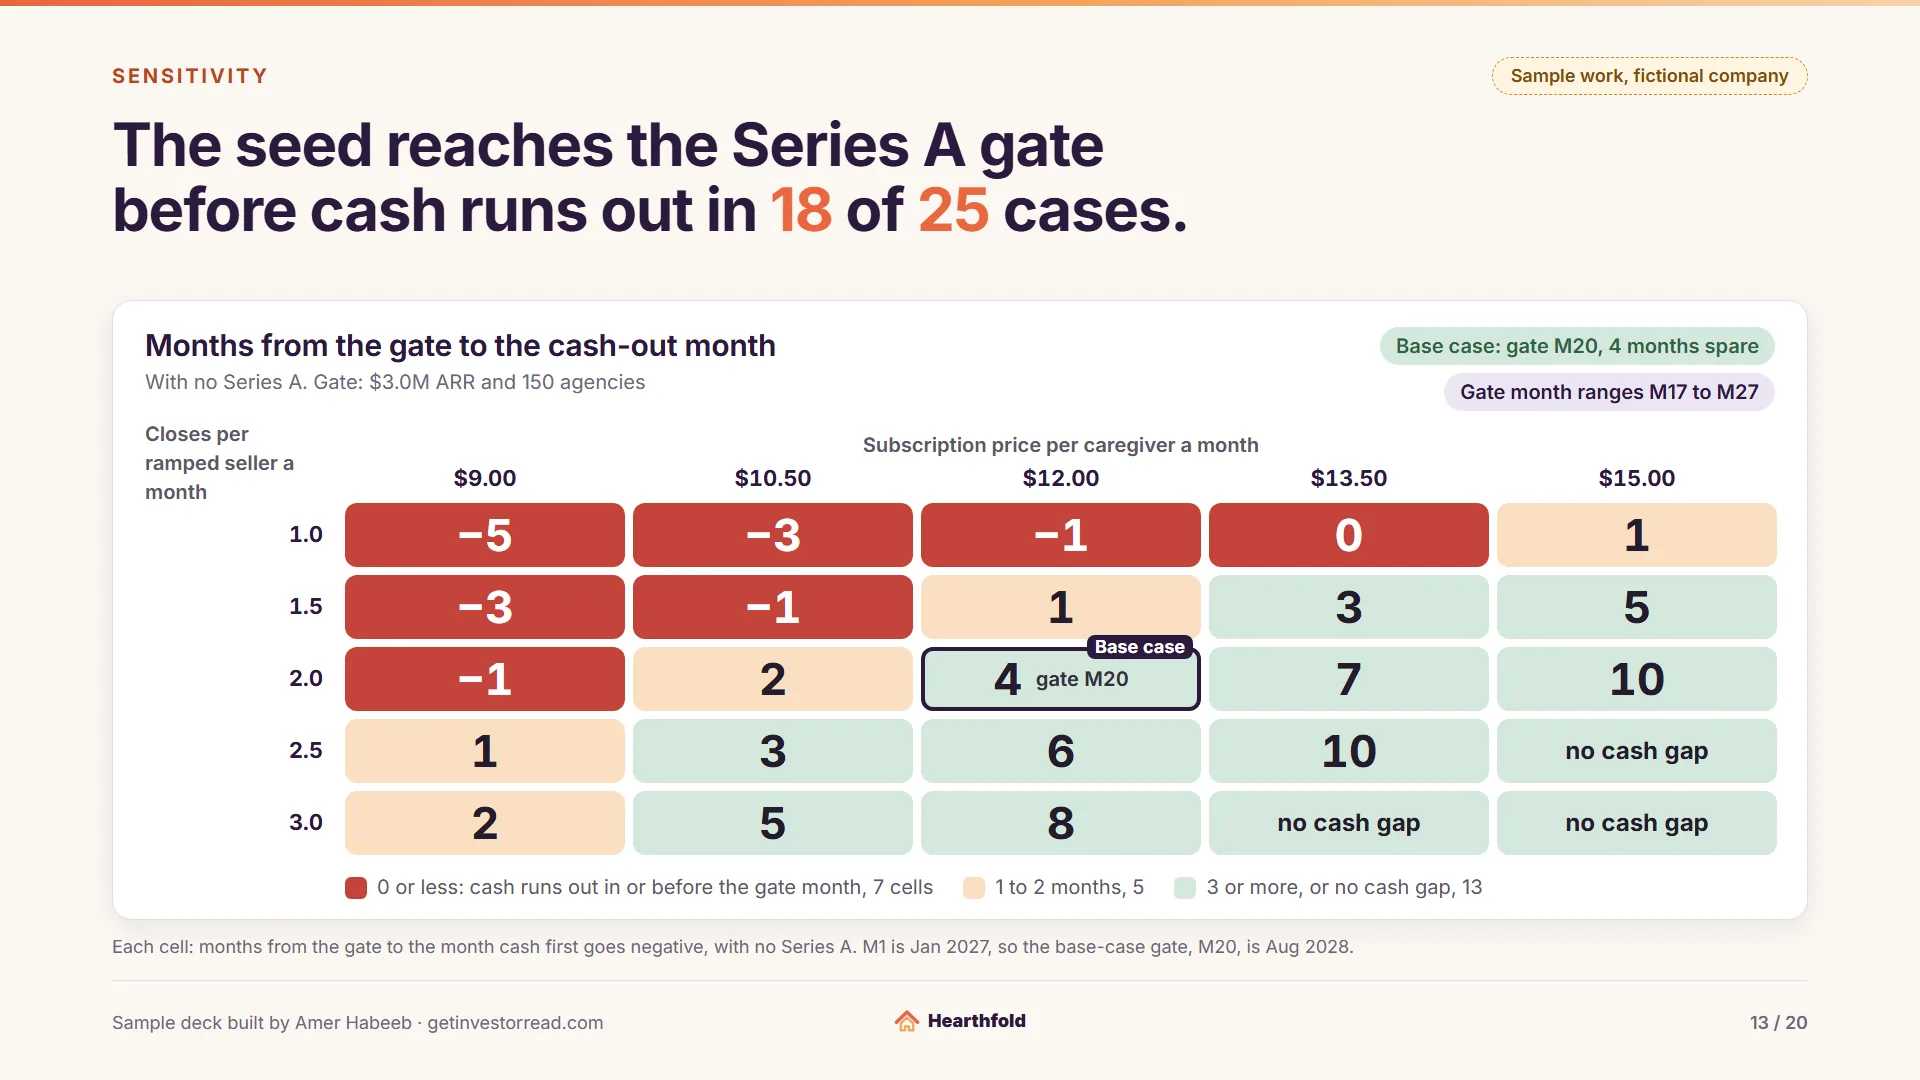
  13. Sample work, fictional company. Sensitivity. Headline: The seed reaches the Series A gate before cash runs out in 18 of 25 cases. Card: Months from the gate to the cash-out month. With no Series A. Gate: $3.0M ARR and 150 agencies. Heat-map, months from the Series A gate to the month cash runs out with no Series A, by closes per ramped seller a month (rows 1.0, 1.5, 2.0, 2.5, 3.0) and subscription price per caregiver a month (columns $9.00, $10.50, $12.00, $13.50, $15.00): 1.0 closes: minus 5, minus 3, minus 1, 0, 1; 1.5 closes: minus 3, minus 1, 1, 3, 5; 2.0 closes: minus 1, 2, 4, 7, 10; 2.5 closes: 1, 3, 6, 10, no cash gap; 3.0 closes: 2, 5, 8, no cash gap, no cash gap. Key: 0 or less: cash runs out in or before the gate month, 7 cells; 1 to 2 months, 5; 3 or more, or no cash gap, 13. Base case outlined at 2.0 closes and $12.00: 4 months, gate M20. Chips: Base case: gate M20, 4 months spare; Gate month ranges M17 to M27. Footnote: Each cell: months from the gate to the month cash first goes negative, with no Series A. M1 is Jan 2027, so the base-case gate, M20, is Aug 2028. (opens full size in a new tab)
    Slide 13 of 20: SensitivityWhy it works. Closes per seller a month against subscription price, 25 cases. The seed reaches the Series A gate before cash runs out in 18 of them, and the 7 where it does not are shown in the same grid. The base case, 2.0 closes at $12.00, is outlined. The grid is the Sensitivity tab.
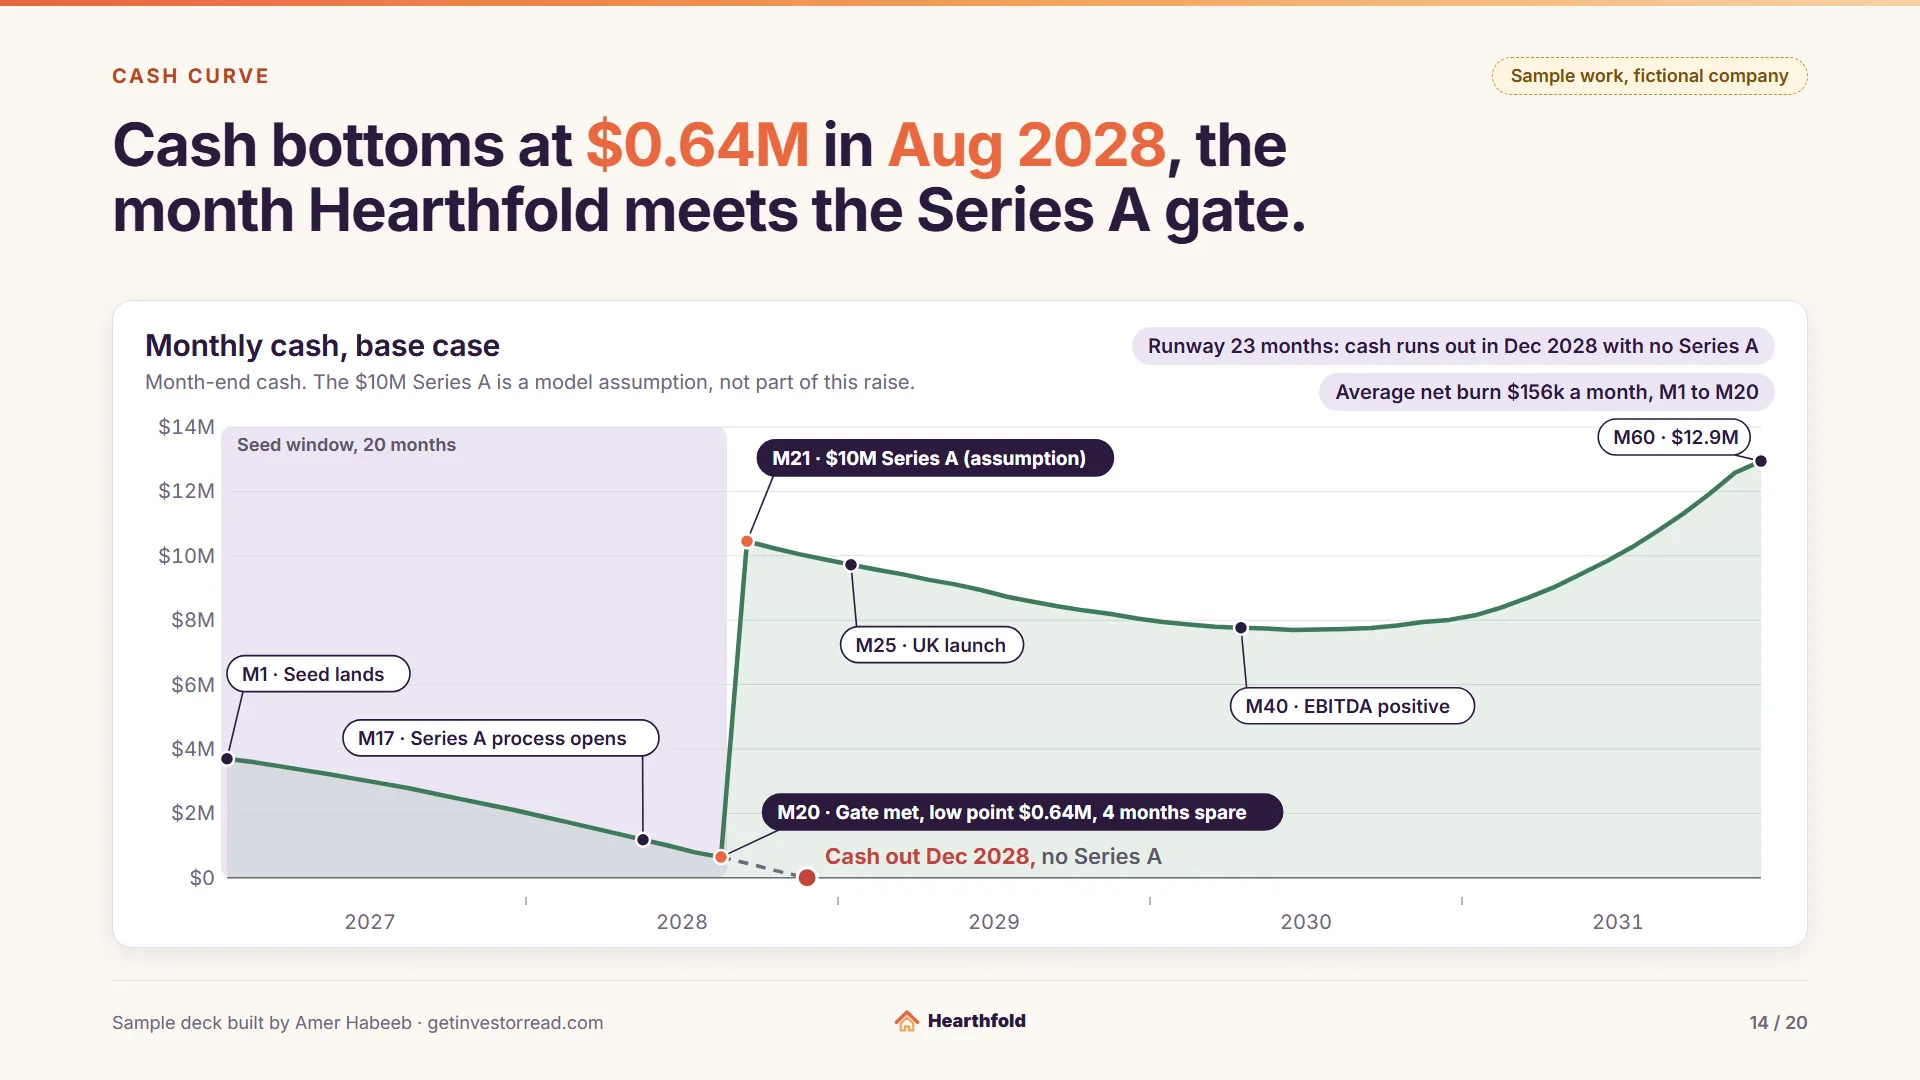
  14. Sample work, fictional company. Cash curve. Headline: Cash bottoms at $0.64M in Aug 2028, the month Hearthfold meets the Series A gate. Card: Monthly cash, base case. Month-end cash. The $10M Series A is a model assumption, not part of this raise. Line chart of month-end cash in the base case from Jan 2027 to Dec 2031, sage line with a light sage area. Cash starts at $3,693k after the seed lands, falls to $0.64M in Aug 2028 (month 20, gate met, 4 months spare), jumps to $10,449k with the $10M Series A in Sep 2028 (a model assumption), dips to $7.70M in Jun 2030 and ends at $12.9M in Dec 2031. A dashed slate line shows the path with no Series A, month-end cash from Aug 2028 to Nov 2028: $639k, $449k, $240k, $53k, then crossing zero at month 23.3 at a brick dot: Cash out Dec 2028, no Series A. Flags: M1 · Seed lands; M17 · Series A process opens; M20 · Gate met, low point $0.64M, 4 months spare; M21 · $10M Series A (assumption); M25 · UK launch; M40 · EBITDA positive; M60 · $12.9M. Seed window, 20 months, shaded. Chips: Runway 23 months: cash runs out in Dec 2028 with no Series A; Average net burn $156k a month, M1 to M20. (opens full size in a new tab)
    Slide 14 of 20: Cash curveWhy it works. Month-end cash for all 60 months, with the seed, the Series A process, the gate and the UK launch marked. Cash bottoms at $0.64M in Aug 2028, the gate month. The line with no Series A is drawn too, and runs out in Dec 2028. The curve is the cash row of the Monthly tab.
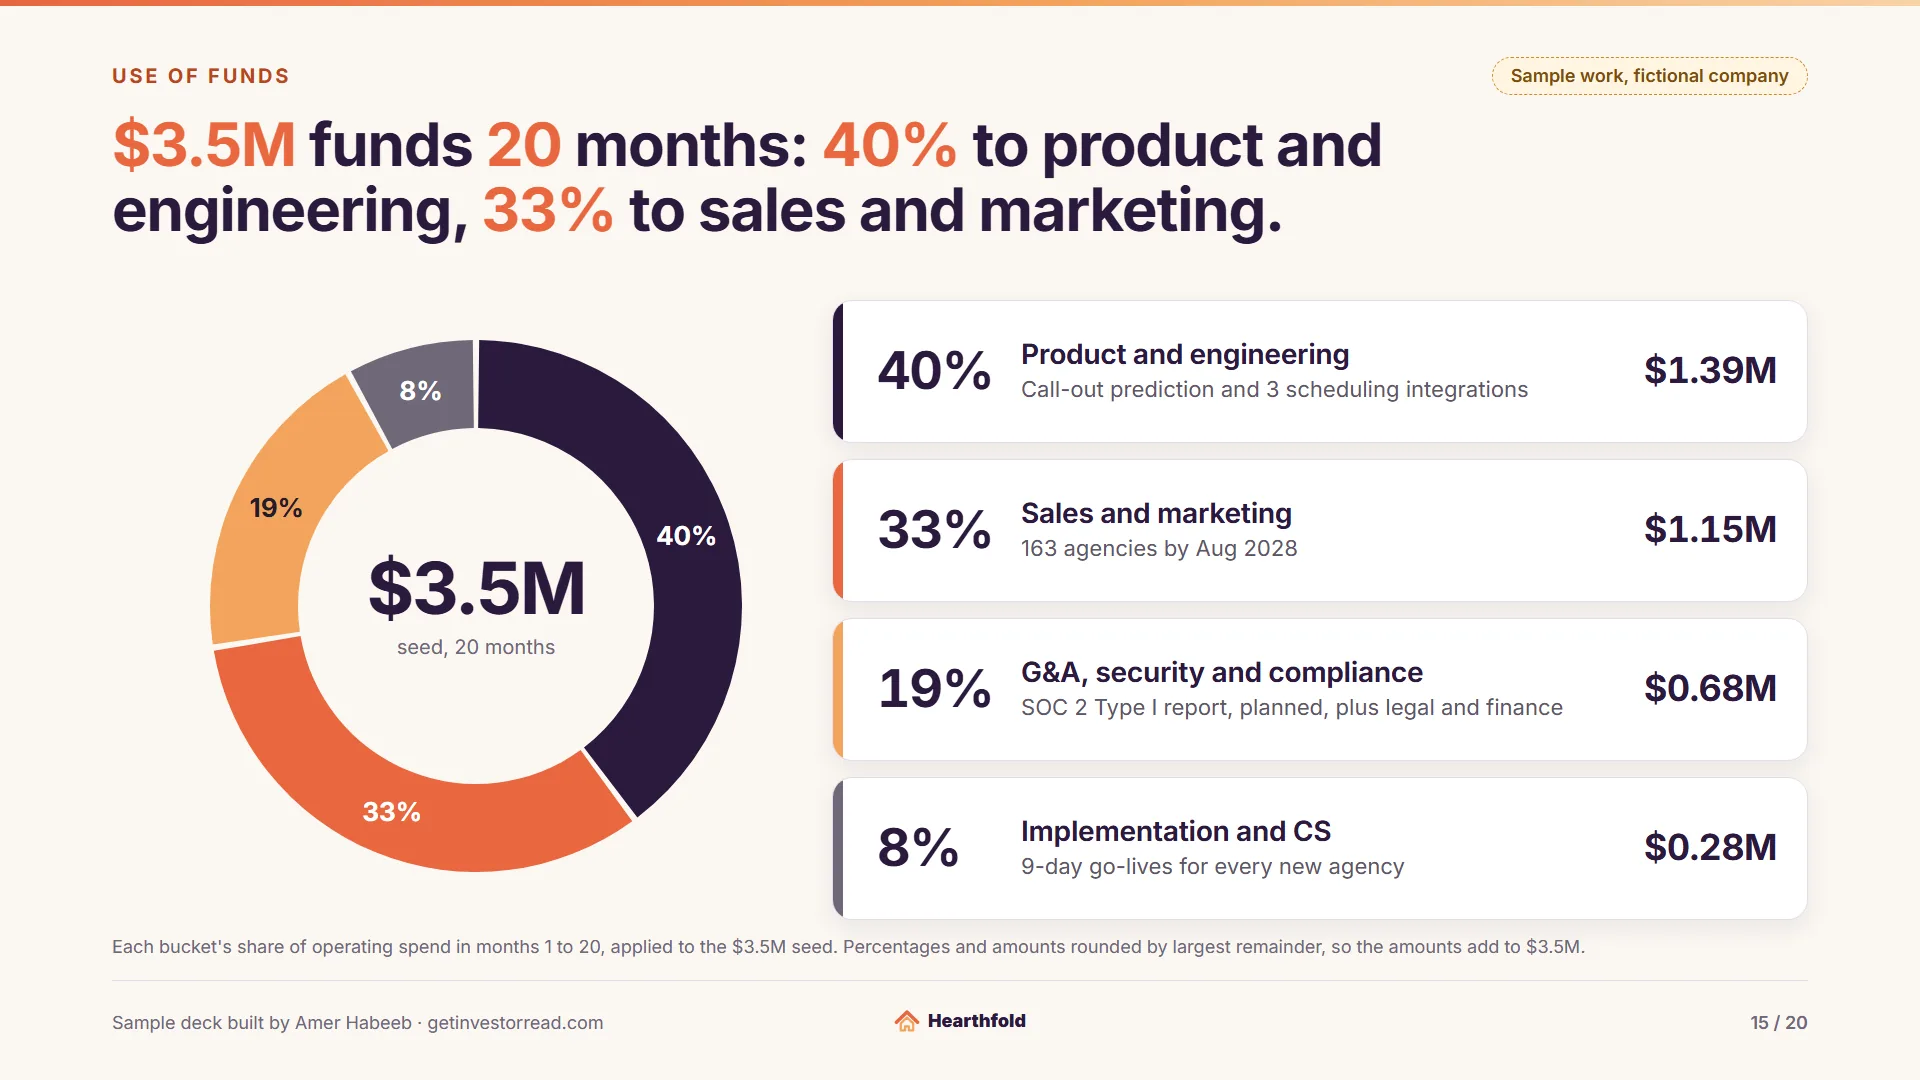
  15. Sample work, fictional company. Use of funds. Headline: $3.5M funds 20 months: 40% to product and engineering, 33% to sales and marketing. Donut chart with $3.5M in the center, labeled seed, 20 months; largest share first: Product and engineering 40%, $1.39M, buys Call-out prediction and 3 scheduling integrations; Sales and marketing 33%, $1.15M, buys 163 agencies by Aug 2028; G&A, security and compliance 19%, $0.68M, buys SOC 2 Type I report, planned, plus legal and finance; Implementation and CS 8%, $0.28M, buys 9-day go-lives for every new agency. Footnote: Each bucket's share of operating spend in months 1 to 20, applied to the $3.5M seed. Percentages and amounts rounded by largest remainder, so the amounts add to $3.5M. (opens full size in a new tab)
    Slide 15 of 20: Use of fundsWhy it works. Each share is that bucket's part of operating spend in months 1 to 20, applied to the $3.5M: 40%, 33%, 19% and 8%. Each line says what it buys, and the amounts add to $3.5M, so the total can be checked against the seed window.
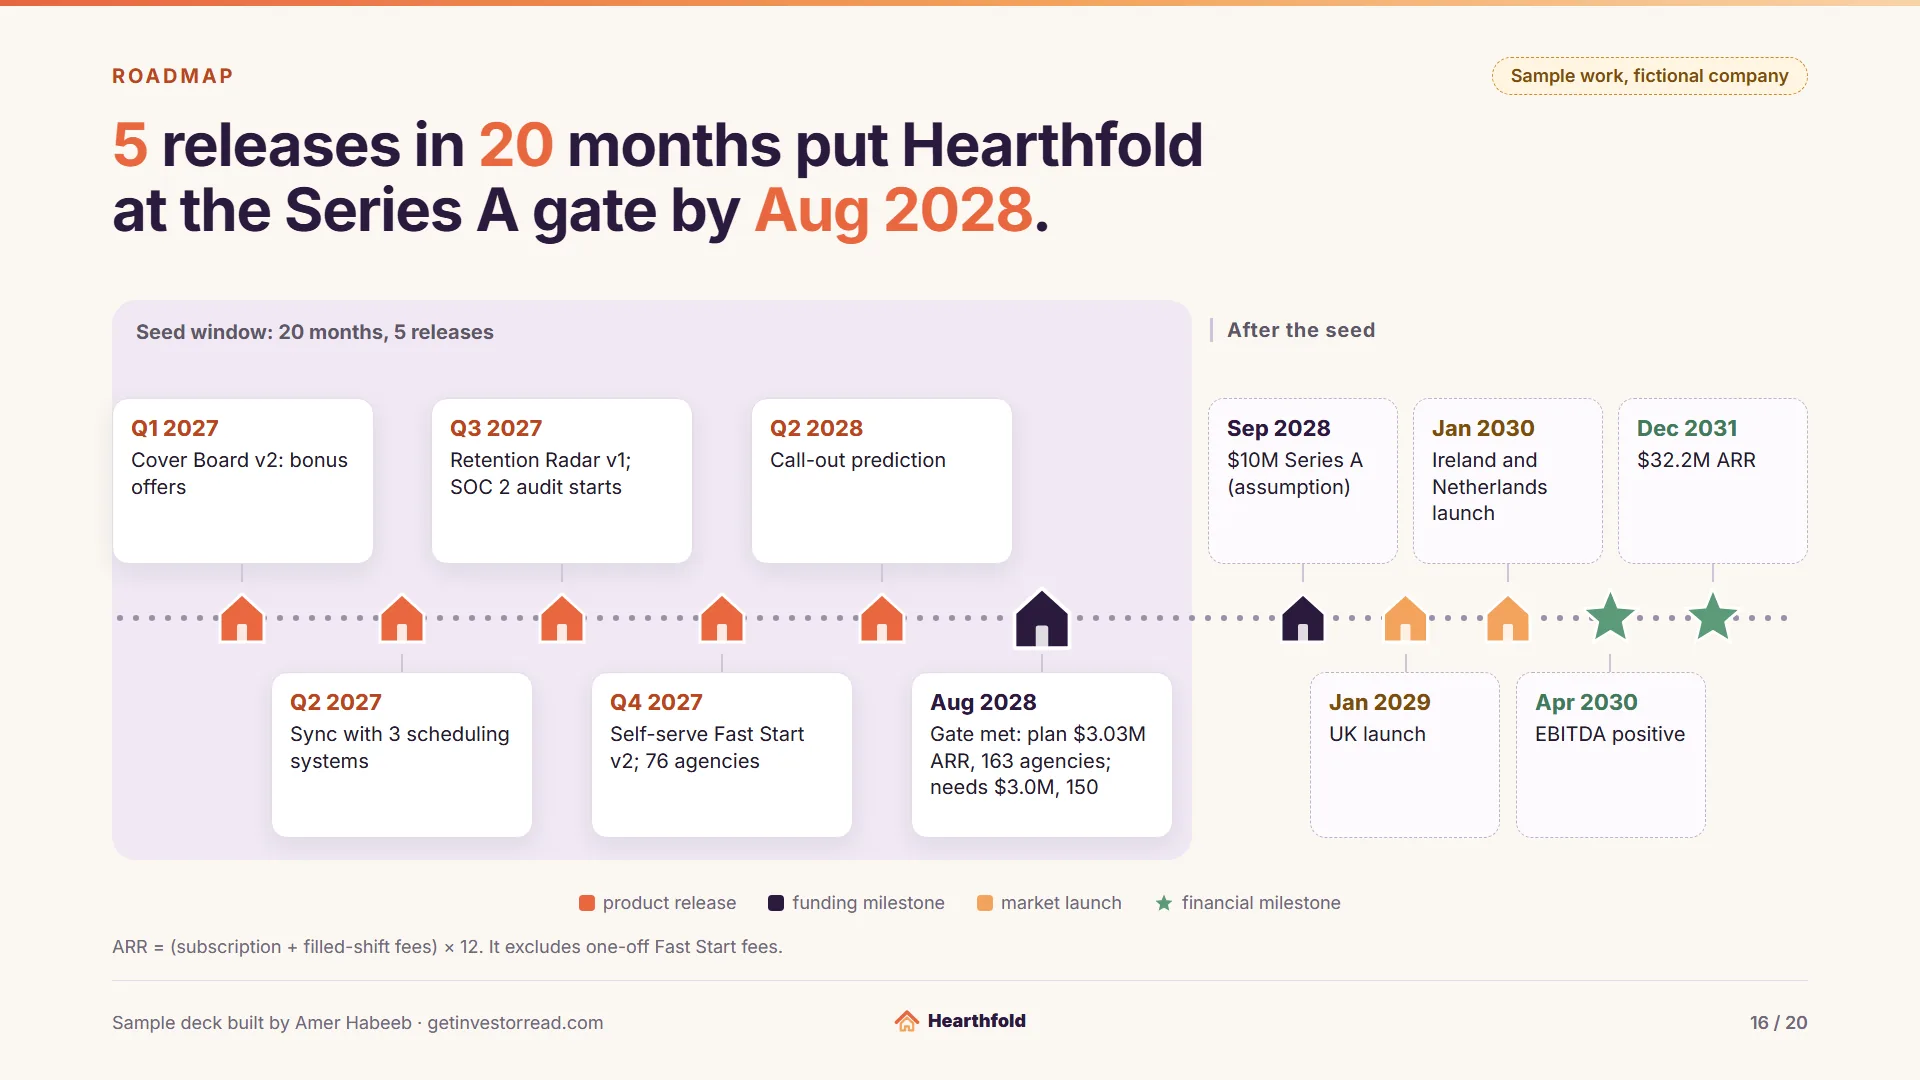
  16. Sample work, fictional company. Roadmap. Headline: 5 releases in 20 months put Hearthfold at the Series A gate by Aug 2028. A dotted gray timeline with markers; a lilac panel is labeled Seed window: 20 months, 5 releases. Q1 2027: Cover Board v2: bonus offers (product release); Q2 2027: Sync with 3 scheduling systems (product release); Q3 2027: Retention Radar v1; SOC 2 audit starts (product release); Q4 2027: Self-serve Fast Start v2; 76 agencies (product release); Q2 2028: Call-out prediction (product release); Aug 2028: Gate met: plan $3.03M ARR, 163 agencies; needs $3.0M, 150 (funding milestone). After the seed, in dashed cards: Sep 2028: $10M Series A (assumption) (funding milestone); Jan 2029: UK launch (market launch); Jan 2030: Ireland and Netherlands launch (market launch); Apr 2030: EBITDA positive (financial milestone); Dec 2031: $32.2M ARR (financial milestone). Legend: product release in coral, funding milestone in aubergine, market launch in apricot, financial milestone as a sage star; each card heading is in its legend color. ARR = (subscription + filled-shift fees) × 12. It excludes one-off Fast Start fees. (opens full size in a new tab)
    Slide 16 of 20: RoadmapWhy it works. An investor asks whether the releases fit the money. The slide puts 5 releases inside the 20-month seed window, then the gate in Aug 2028: the plan reaches $3.03M ARR and 163 agencies against the $3.0M and 150 required. Later milestones sit in dashed cards.
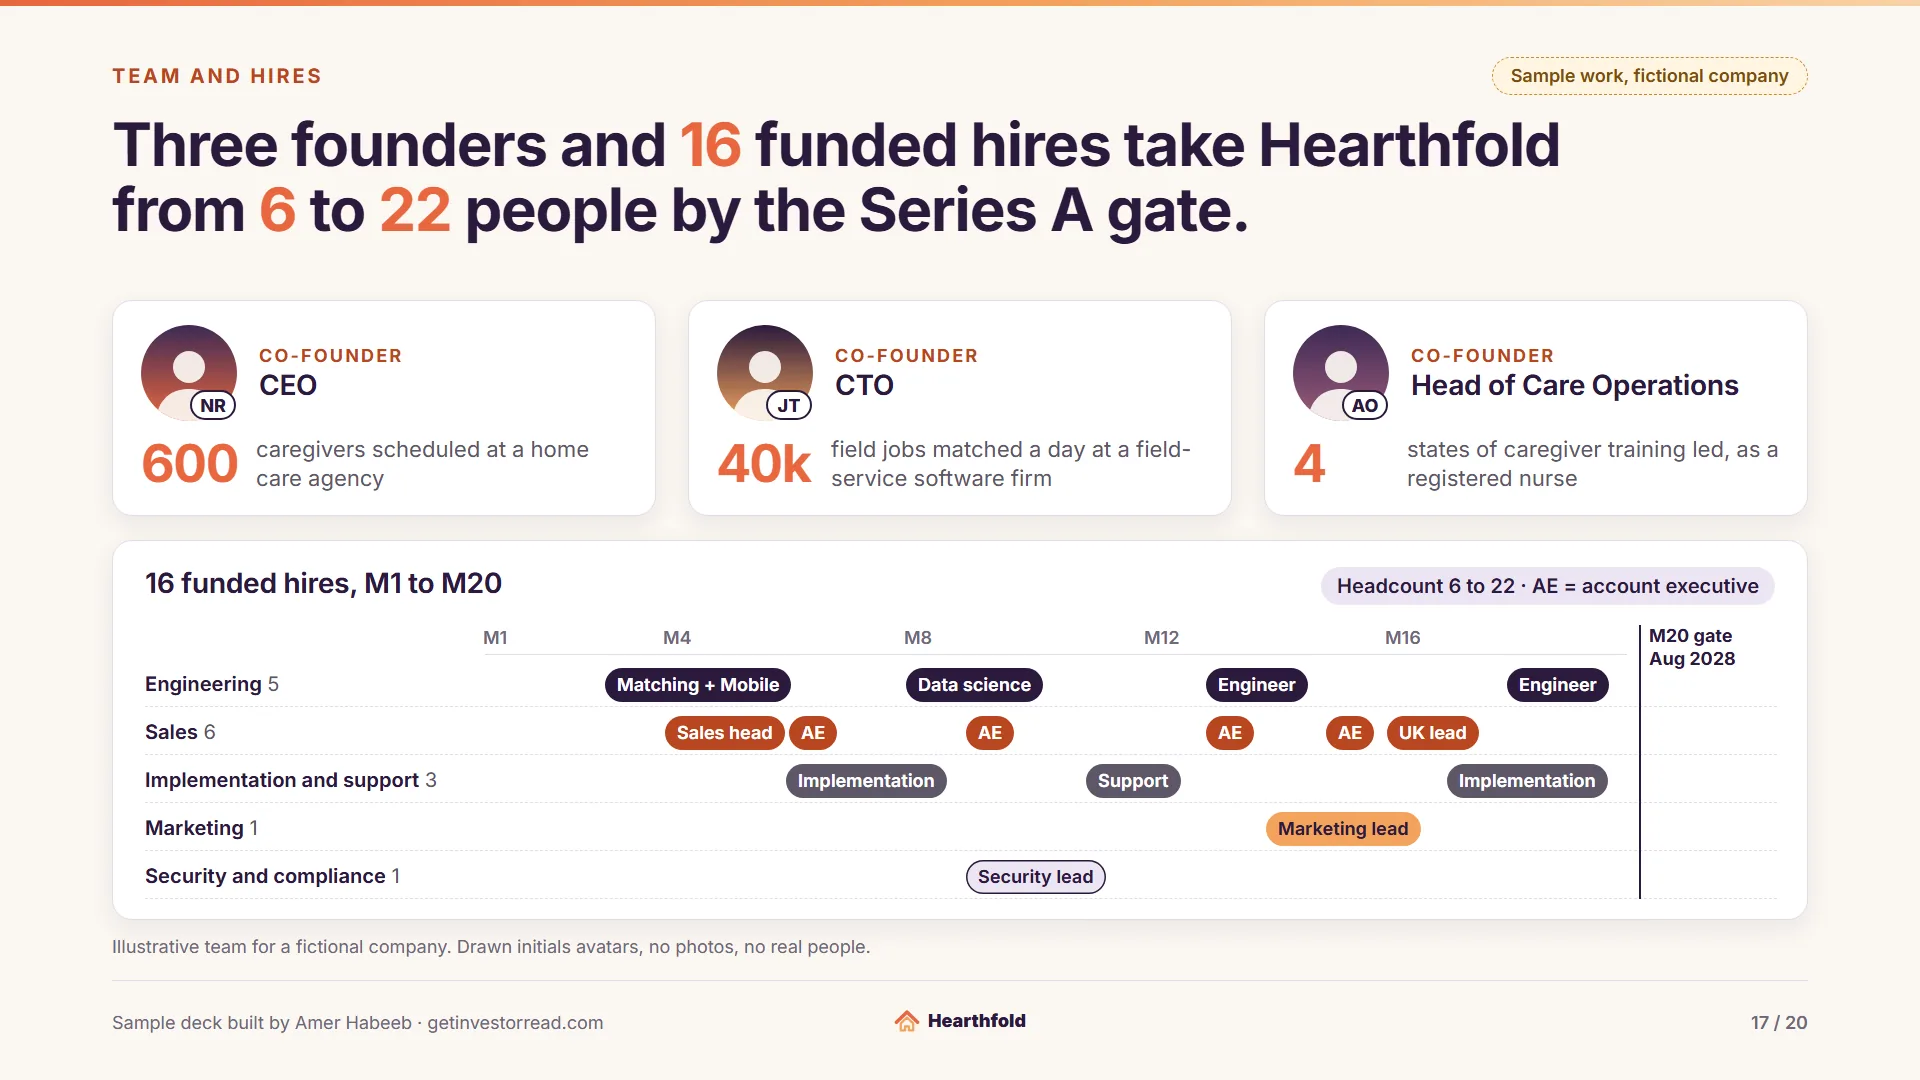
  17. Sample work, fictional company. Team and hires. Headline: Three founders and 16 funded hires take Hearthfold from 6 to 22 people by the Series A gate. Three founder cards with drawn avatars, each a dawn disc with a flat figure and an initials badge: NR, Co-founder and CEO: 600 caregivers scheduled at a home care agency. JT, Co-founder and CTO: 40k field jobs matched a day at a field-service software firm. AO, Co-founder and Head of Care Operations: 4 states of caregiver training led, as a registered nurse. Hire strip, 16 funded hires, M1 to M20, one chip per start month: Engineering 5: M3 Matching + Mobile (Matching engineer and Mobile engineer), M8 Data science (Data scientist, call-out prediction), M13 Engineer, M18 Engineer; Sales 6: M4 Sales head (Head of sales), M6 AE (Account executive, US), M9 AE (Account executive, US), M13 AE (Account executive, US), M15 AE (Account executive, US), M16 UK lead (UK market lead); Implementation and support 3: M6 Implementation (Implementation manager), M11 Support (Support specialist), M17 Implementation (Implementation specialist); Marketing 1: M14 Marketing lead; Security and compliance 1: M9 Security lead (Security and compliance lead). A vertical line marks the M20 gate, Aug 2028. Chip: Headcount 6 to 22 · AE = account executive. Footnote: Illustrative team for a fictional company. Drawn initials avatars, no photos, no real people. (opens full size in a new tab)
    Slide 17 of 20: Team and hiresWhy it works. The hiring plan is the cost plan. Each of the 16 funded hires has a start month, from M3 to M18, so an investor can match headcount, 6 to 22 by the M20 gate, to the payroll lines in the model. The founders are drawn initials, labeled illustrative.
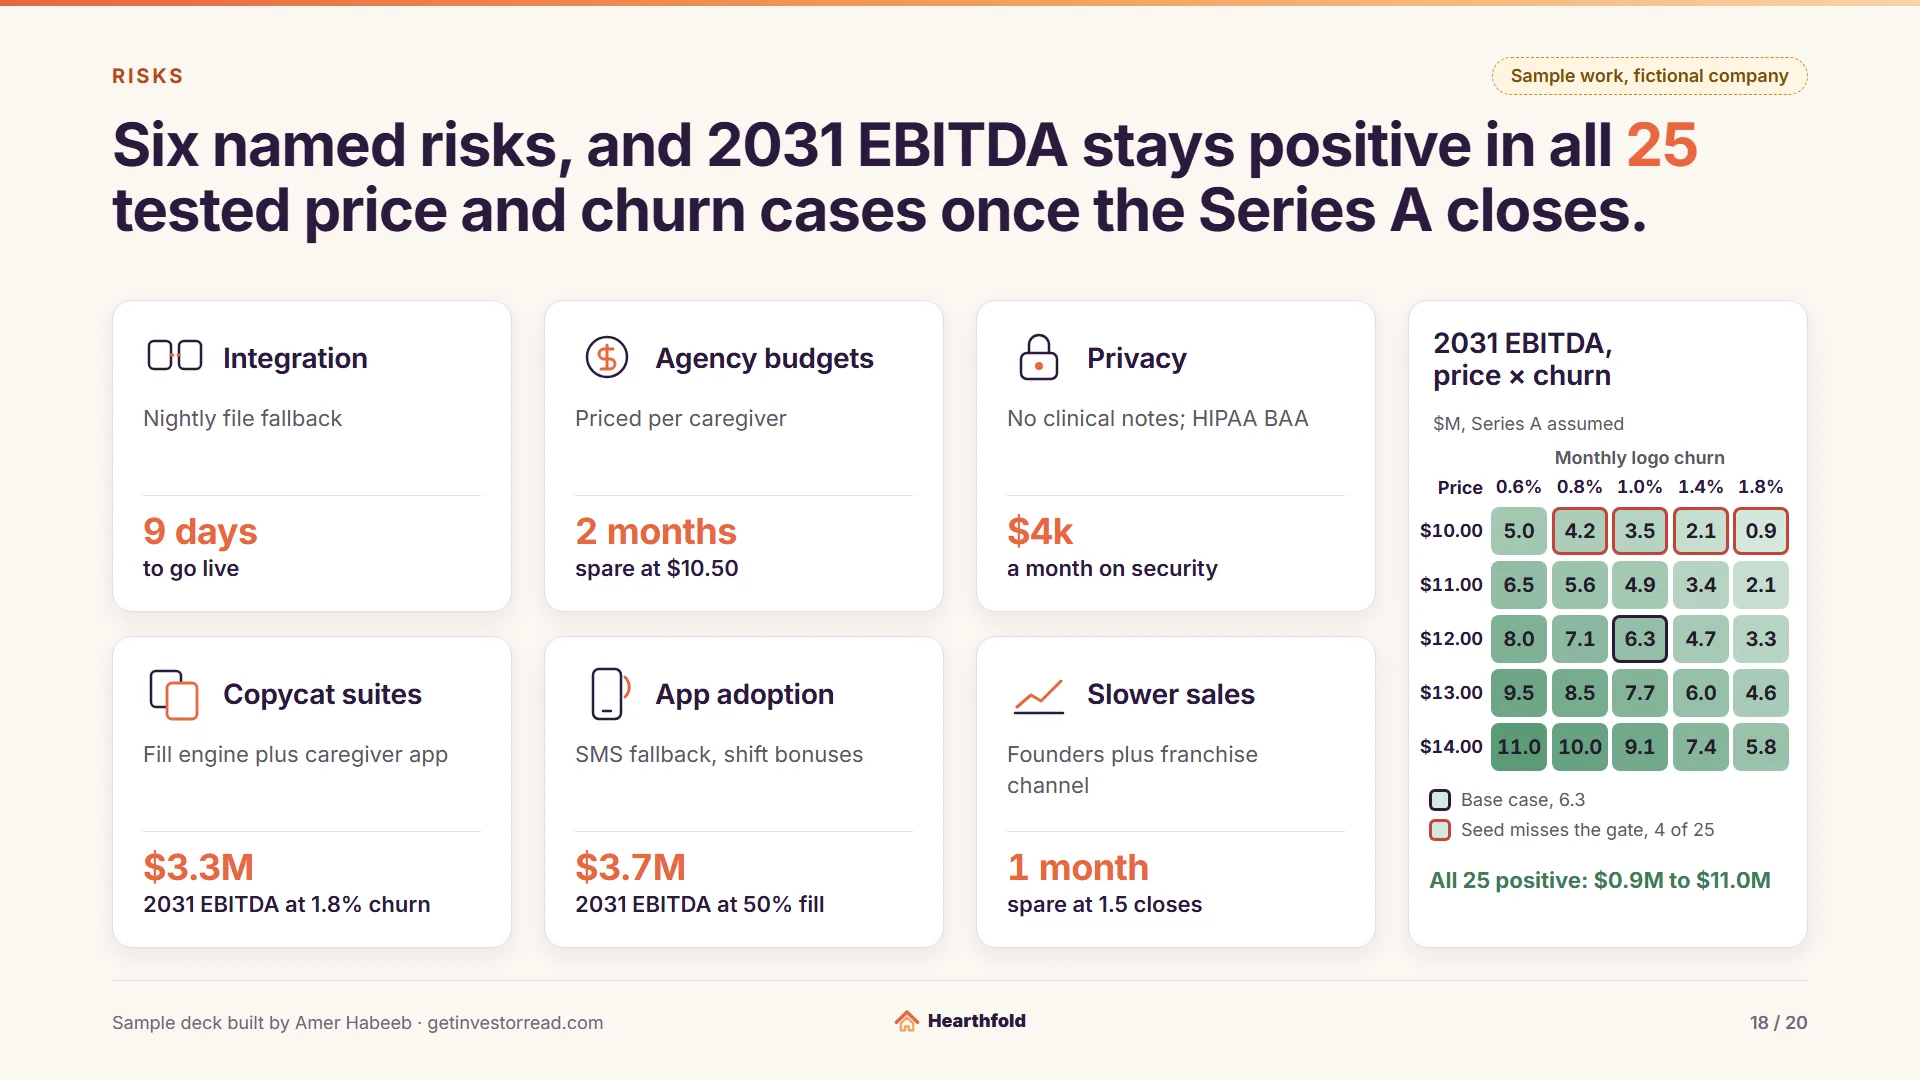
  18. Sample work, fictional company. Risks. Headline: Six named risks, and 2031 EBITDA stays positive in all 25 tested price and churn cases once the Series A closes. Six cards, each a risk, a mitigation and a model test result in coral: Integration: Nightly file fallback. Model test: 9 days to go live; Agency budgets: Priced per caregiver. Model test: 2 months spare at $10.50; Privacy: No clinical notes; HIPAA BAA. Model test: $4k a month on security; Copycat suites: Fill engine plus caregiver app. Model test: $3.3M 2031 EBITDA at 1.8% churn; App adoption: SMS fallback, shift bonuses. Model test: $3.7M 2031 EBITDA at 50% fill; Slower sales: Founders plus franchise channel. Model test: 1 month spare at 1.5 closes. Heat-map, 2031 EBITDA, price × churn, $M, Series A assumed: subscription price per caregiver a month (rows $10.00, $11.00, $12.00, $13.00, $14.00) by monthly logo churn (columns 0.6%, 0.8%, 1.0%, 1.4%, 1.8%): $10.00: 5.0, 4.2, 3.5, 2.1, 0.9; $11.00: 6.5, 5.6, 4.9, 3.4, 2.1; $12.00: 8.0, 7.1, 6.3, 4.7, 3.3; $13.00: 9.5, 8.5, 7.7, 6.0, 4.6; $14.00: 11.0, 10.0, 9.1, 7.4, 5.8. Key: Base case, 6.3, outlined in aubergine; Seed misses the gate, 4 of 25, outlined in brick: the seed misses the gate before cash runs out at $10.00 with churn of 0.8% or more. All 25 positive: $0.9M to $11.0M. (opens full size in a new tab)
    Slide 18 of 20: RisksWhy it works. Six named risks, each with a mitigation and a result from the model. At a 50% fill rate, 2031 EBITDA is still $3.7M. At 1.5 closes a seller a month, the gate is met with 1 month spare. The grid tests price against churn: all 25 cases stay positive once the Series A closes.
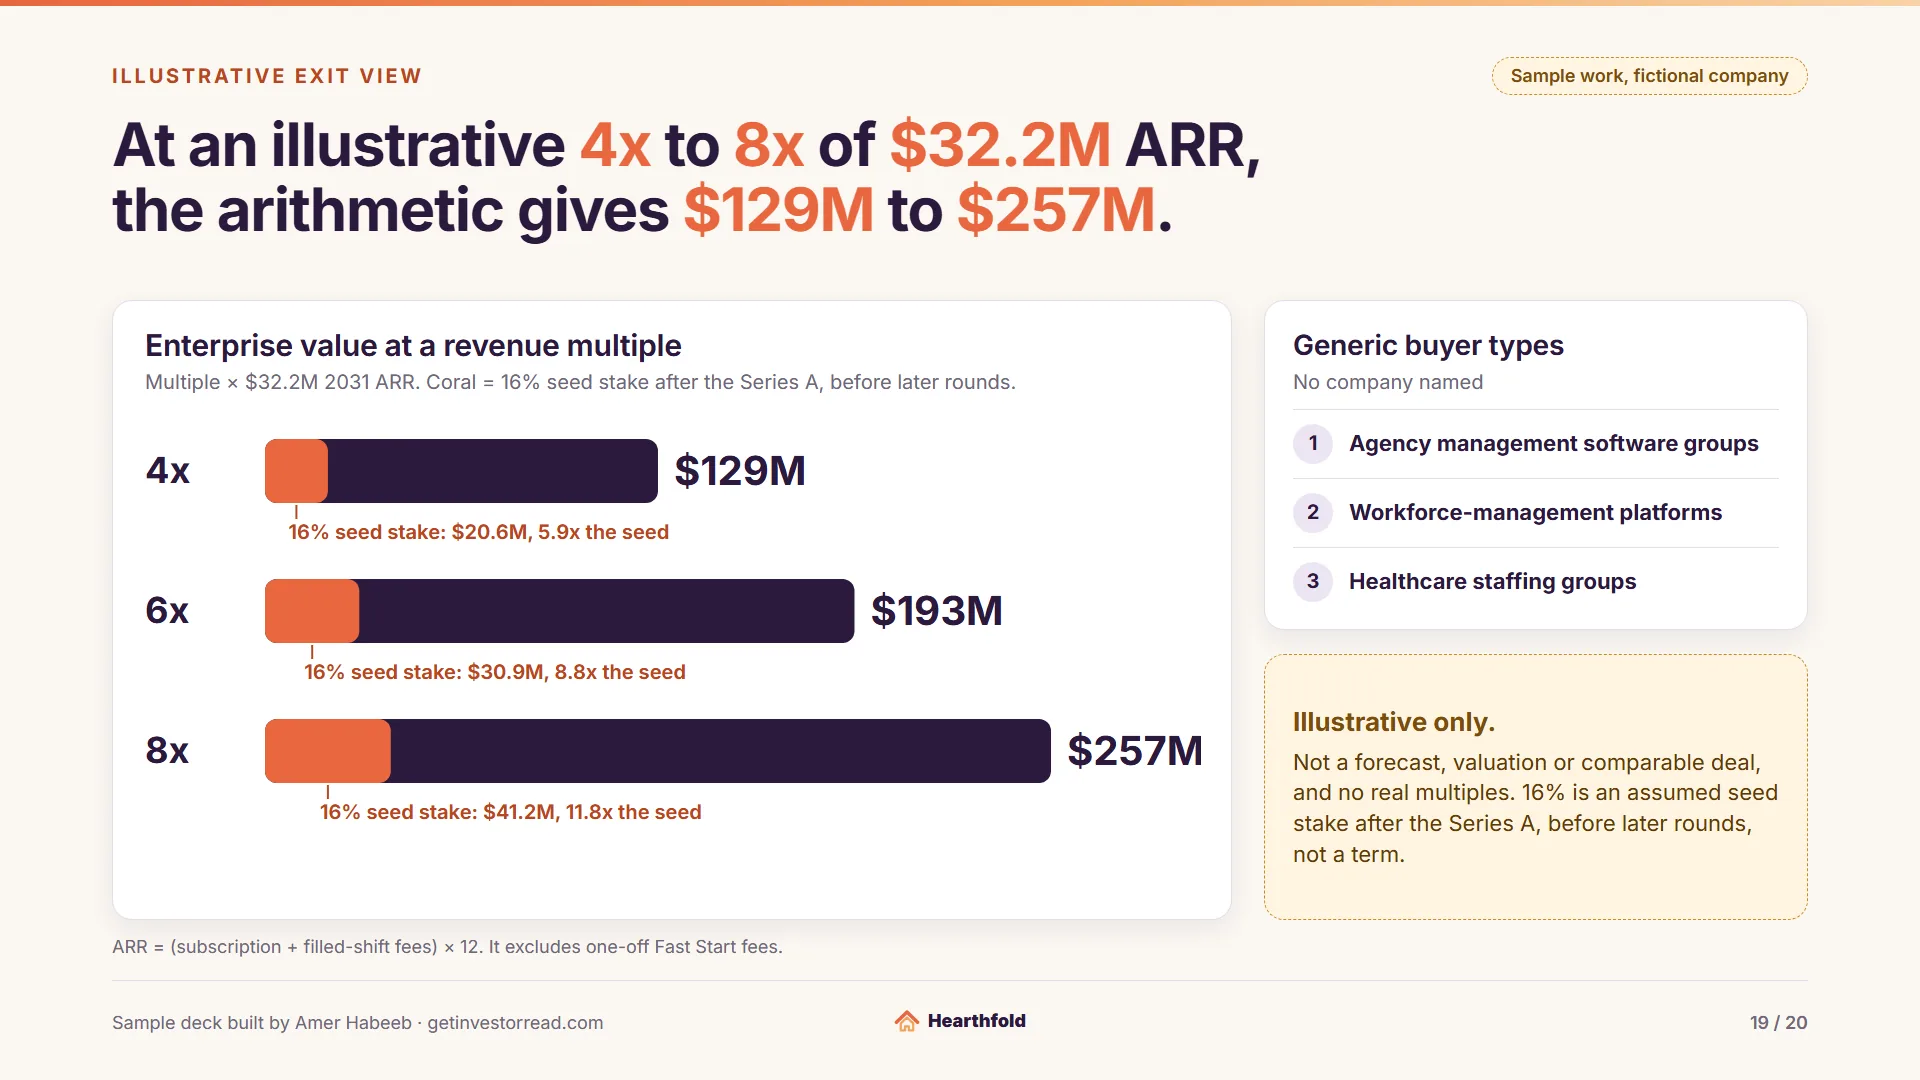
  19. Sample work, fictional company. Illustrative exit view. Headline: At an illustrative 4x to 8x of $32.2M ARR, the arithmetic gives $129M to $257M. Card: Enterprise value at a revenue multiple. Multiple × $32.2M 2031 ARR. Coral = 16% seed stake after the Series A, before later rounds. Three horizontal bars: 4x $32.2M 2031 ARR = $129M, 6x = $193M, 8x = $257M; a coral segment in each bar marks the 16% seed stake after the Series A, before later rounds, labeled 16% seed stake: $20.6M, 5.9x the seed; 16% seed stake: $30.9M, 8.8x the seed; 16% seed stake: $41.2M, 11.8x the seed. Generic buyer types, no company named: agency management software groups, workforce-management platforms, healthcare staffing groups. Label: Illustrative only. Not a forecast, valuation or comparable deal, and no real multiples. 16% is an assumed seed stake after the Series A, before later rounds, not a term. Footnote: ARR = (subscription + filled-shift fees) × 12. It excludes one-off Fast Start fees. (opens full size in a new tab)
    Slide 19 of 20: Illustrative exit viewWhy it works. The exit is arithmetic and labeled as such: 4x to 8x of $32.2M 2031 ARR gives $129M to $257M. No buyer is named, no real multiple or comparable deal is used, and the 16% seed stake is an assumption, not a term.
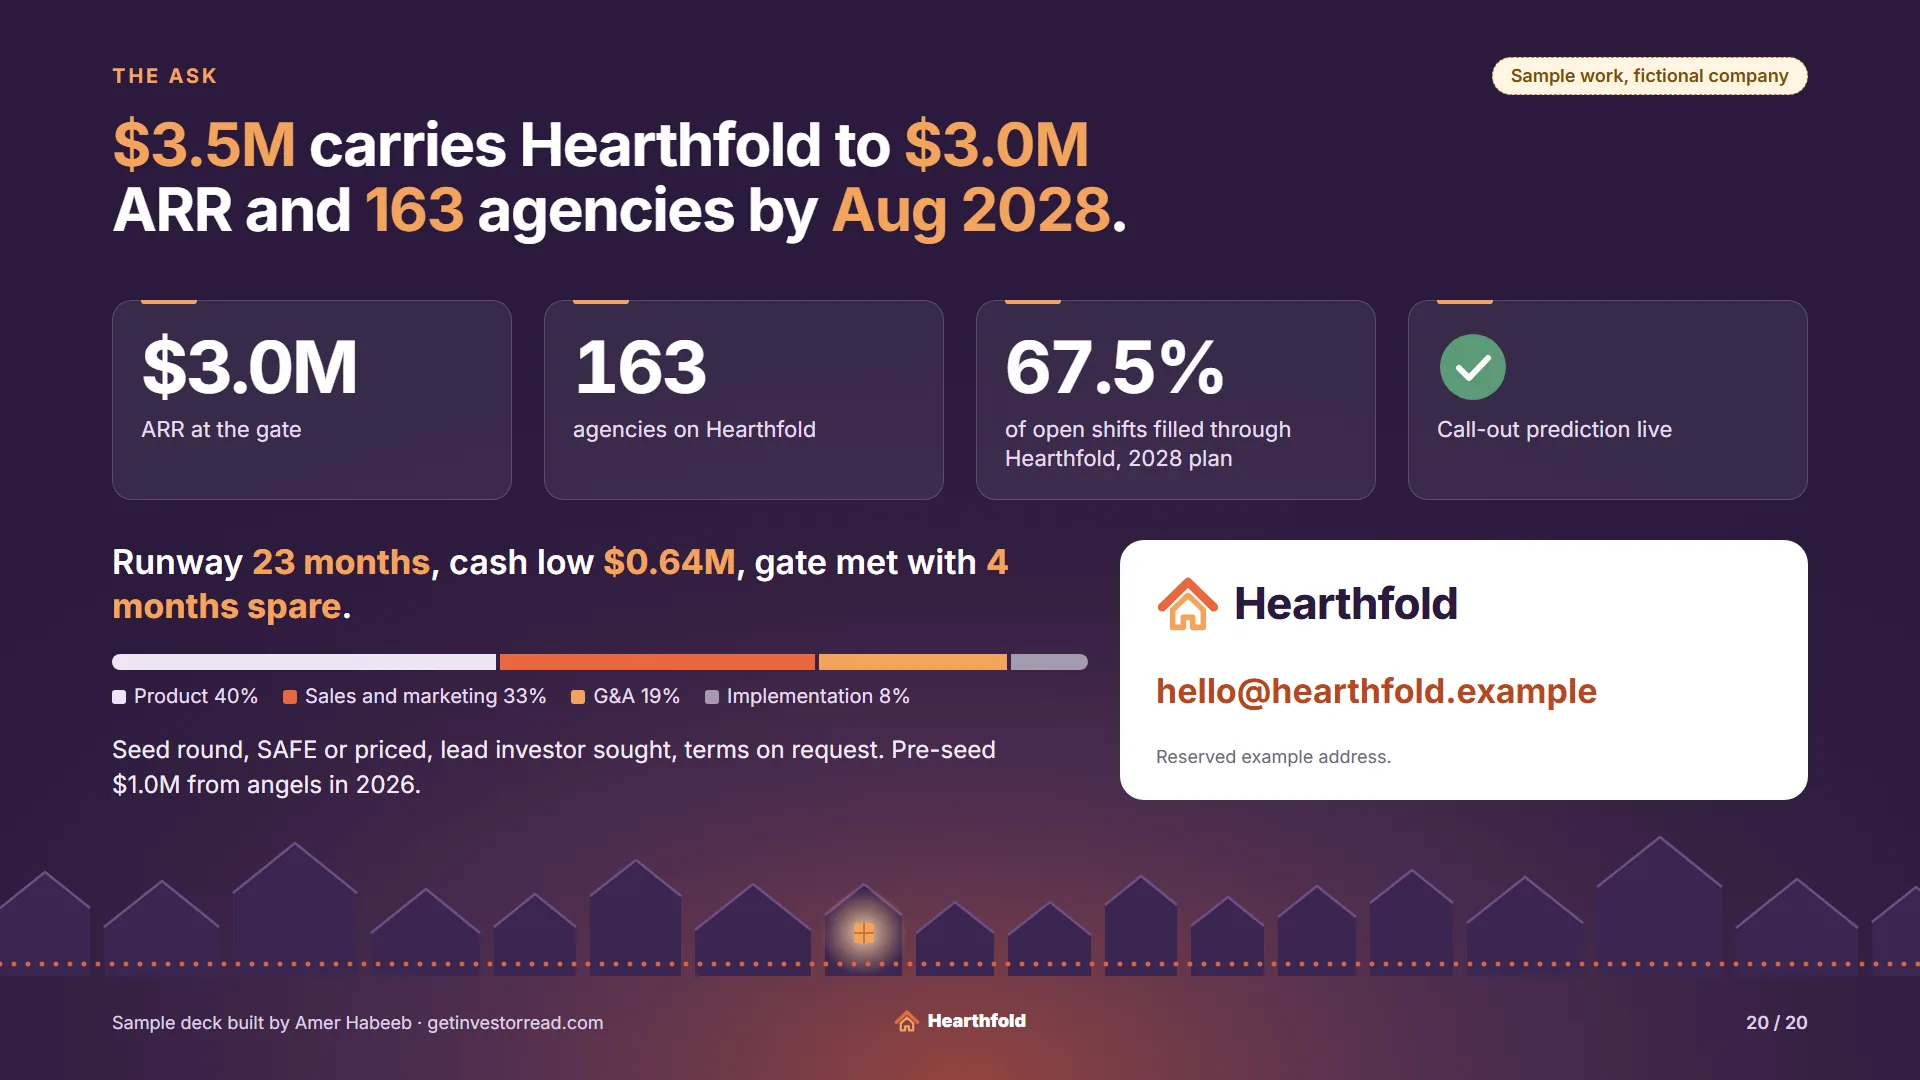
  20. Sample work, fictional company. The ask. Headline: $3.5M carries Hearthfold to $3.0M ARR and 163 agencies by Aug 2028. Four milestone tiles: $3.0M ARR at the gate; 163 agencies on Hearthfold; 67.5% of open shifts filled through Hearthfold, 2028 plan; a check mark: Call-out prediction live. Runway 23 months, cash low $0.64M, gate met with 4 months spare. Use of funds bar: Product 40%, Sales and marketing 33%, G&A 19%, Implementation 8%. Terms: seed round, SAFE or priced, lead investor sought, terms on request. Pre-seed $1.0M from angels in 2026. Contact: hello@hearthfold.example, a reserved example address. Drawn skyline of houses with a dotted coral route along the bottom. (opens full size in a new tab)
    Slide 20 of 20: The askWhy it works. The close repeats what an investor will hold the founder to: $3.0M ARR and 163 agencies by Aug 2028, with 23 months of runway and a cash low of $0.64M. Terms are on request, and the contact is a reserved example address.

How investors test a seed deck, worked on these slides: Seed pitch deck help: the six questions investors test. Why every slide above was built from the model, and five checks for your own deck: why the deck should be built from the model.

About this sample

Label
Sample work, fictional company
Company
Hearthfold is invented, and so are its founders, its 11 pilot agencies, the pilot results and the quote on slide 6. The founders on slide 17 are drawn initials, not photos of real people. Slides 3 and 4 cite three outside facts, each with its source named on the slide.
Stage
Seed, raising $3.5M, as stated in the deck
What I built
The 20-slide seed deck and the 5-year monthly model behind it, in US dollars. The model has 9 tabs, from README to Checks, and all 12 checks on its Checks tab pass.
Permission
Not needed: a fictional company
Outcome
This page makes no claim about the raise.

What a sample cannot show: no real founder, no real outcome. It shows how the deck and the model are built and checked. Real decks appear on the work page only with the founder's written permission.

Get my free Investor Read

Want to know what an investor would ask about your deck? The read is free.

Updated

Get my free Investor Read